Contents
- General canvas
- Basic overlay window
- Settings menu
- Search menu
- Time slider
- Centrality metrics
- (Non-)kinship networks
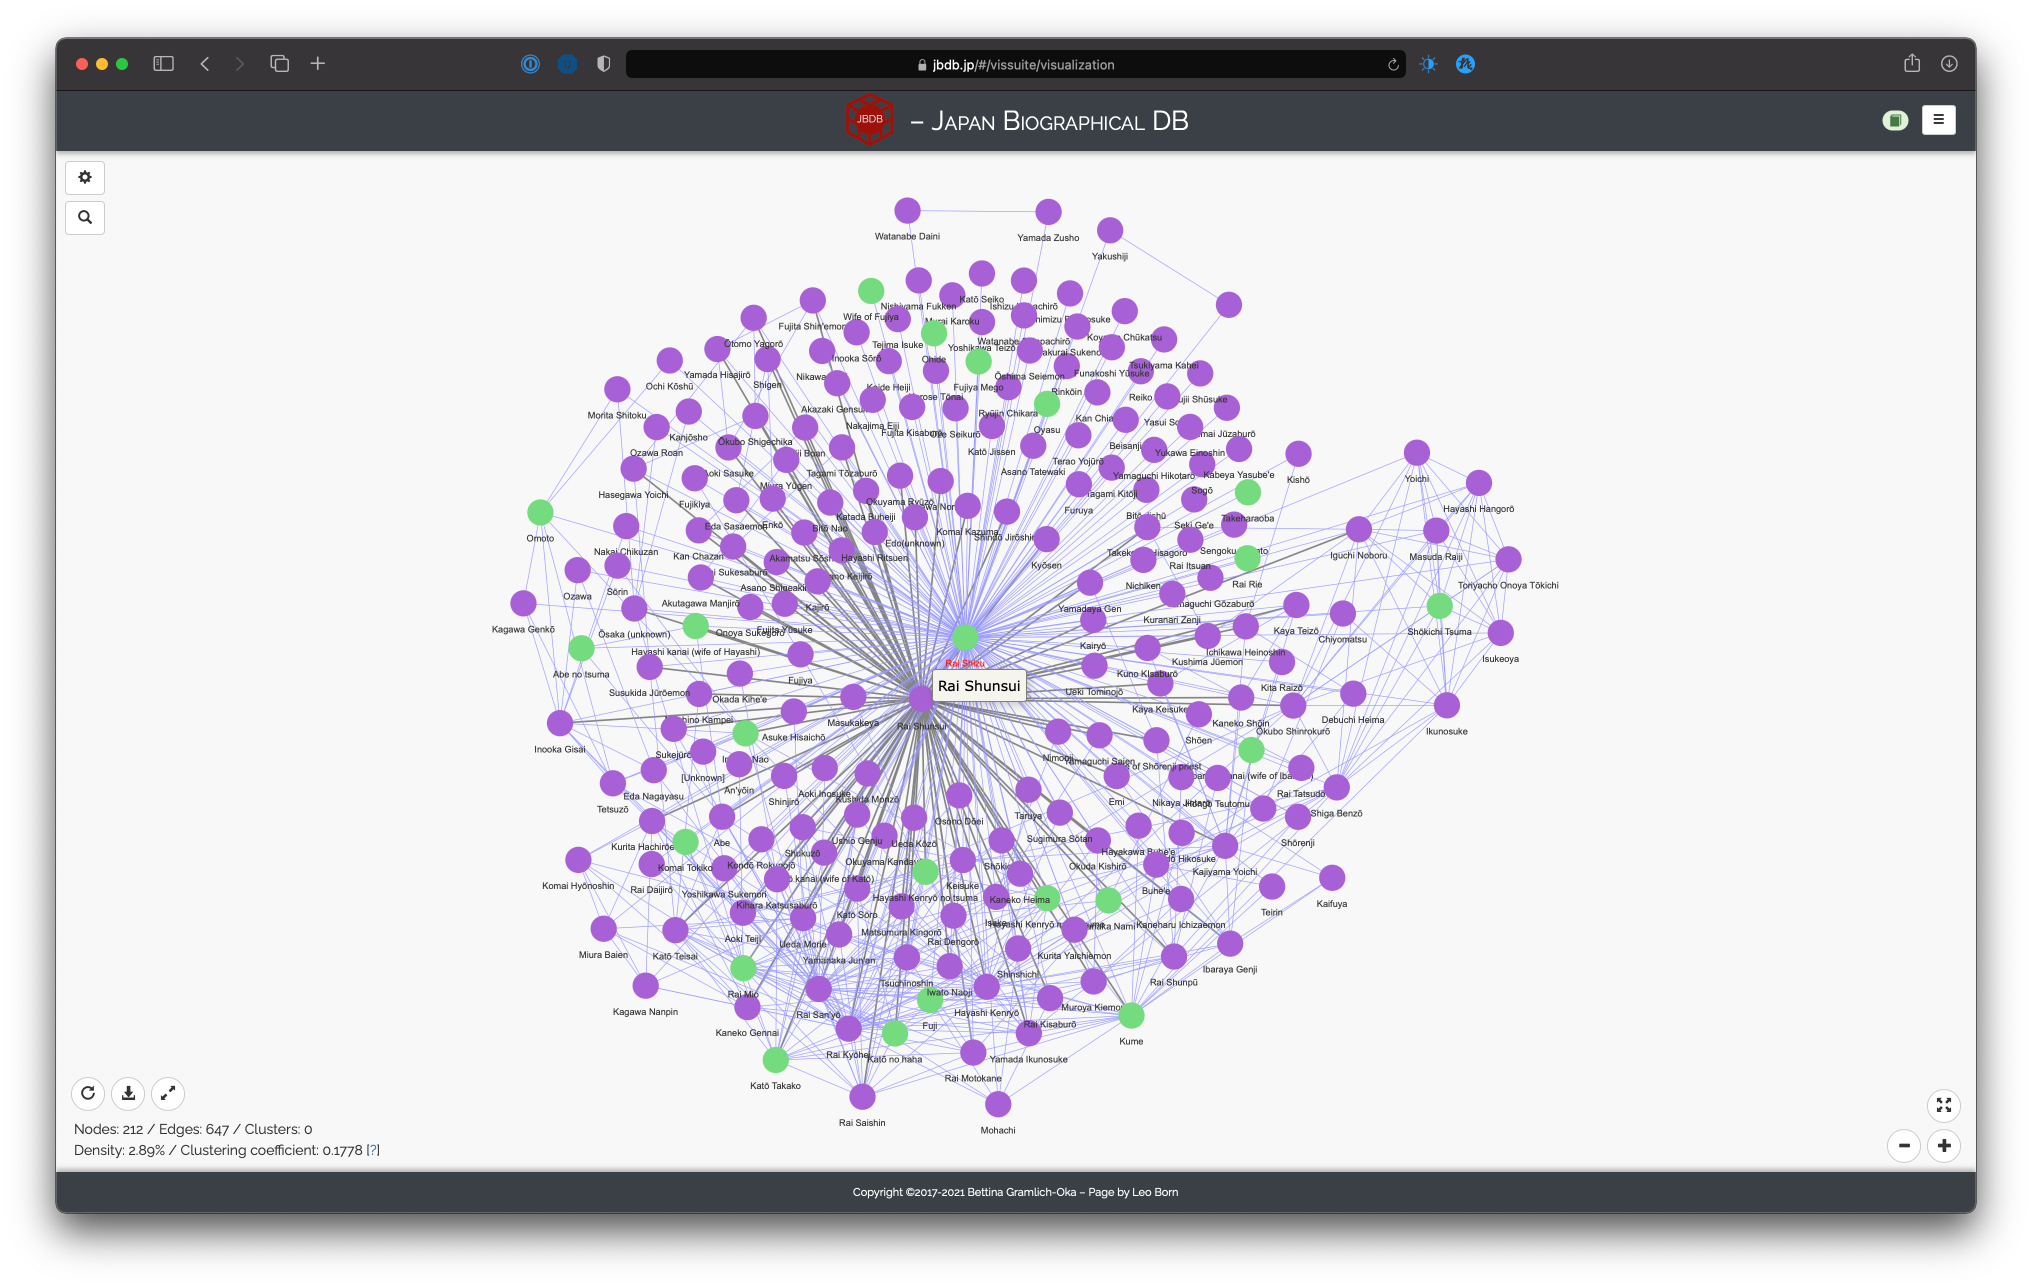
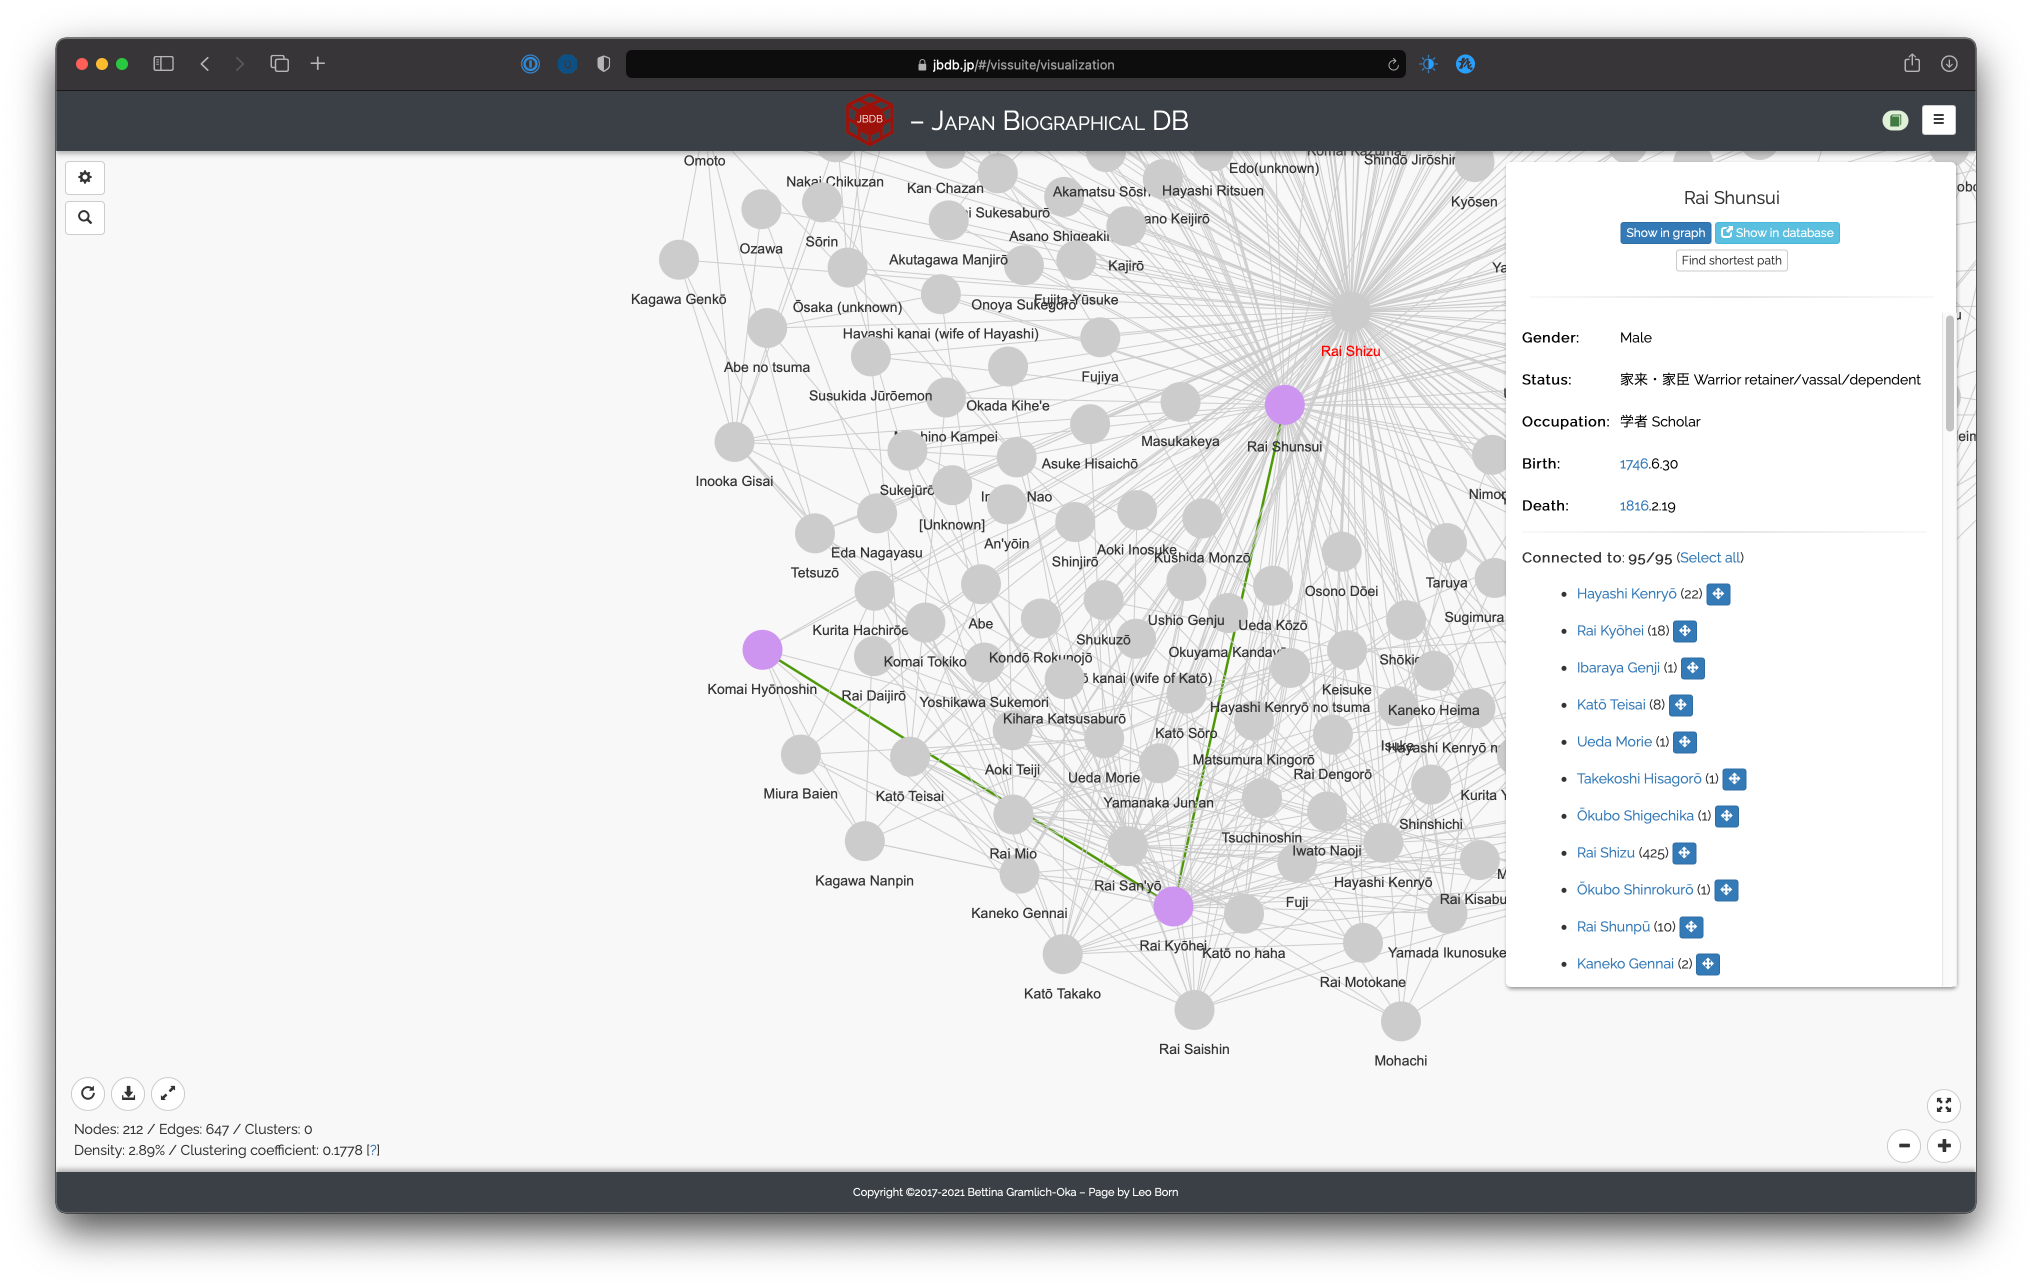
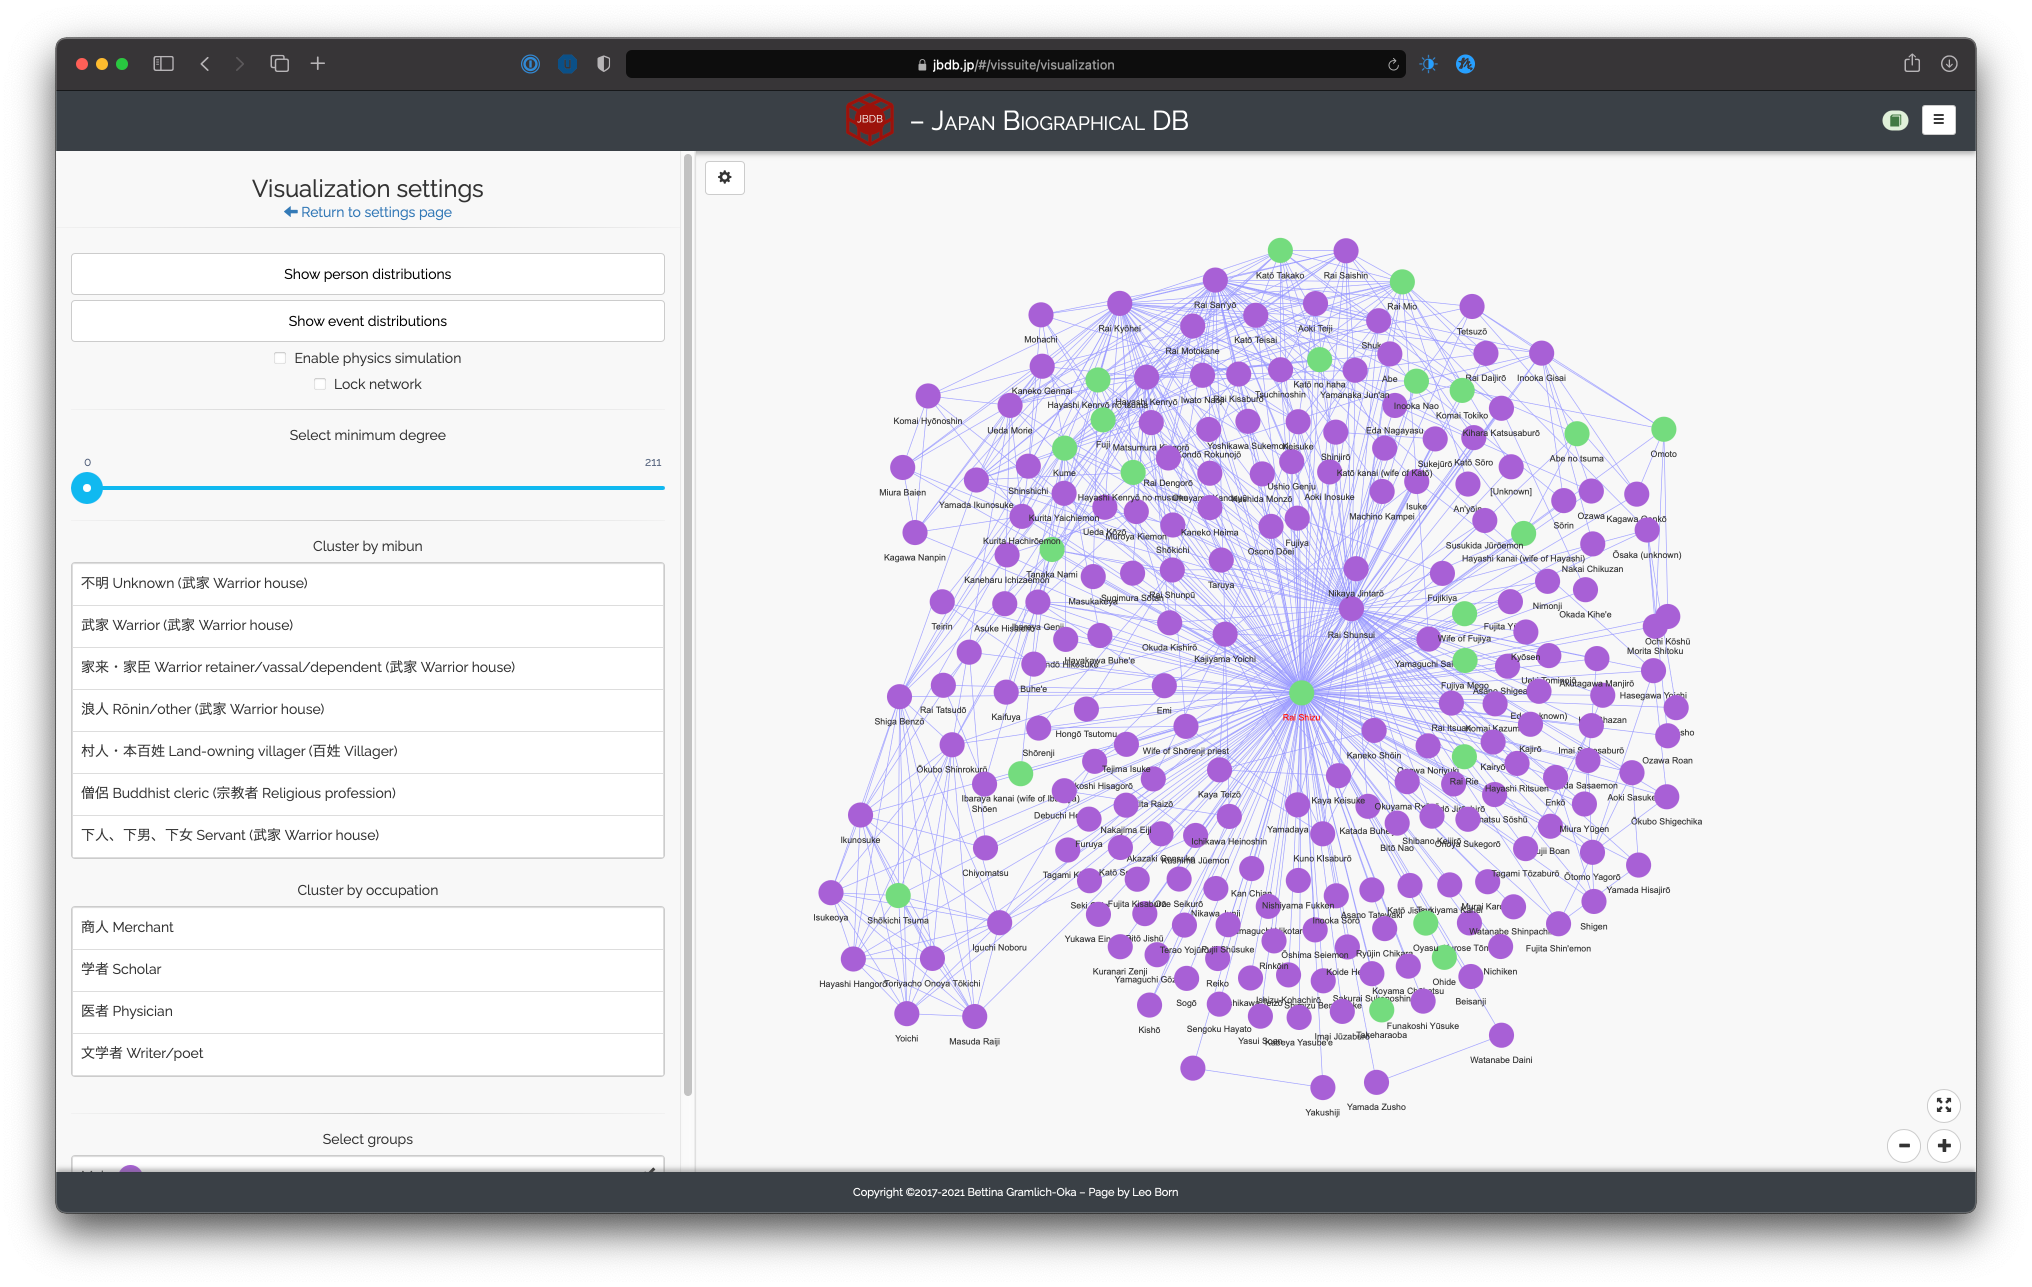
Once you have selected the criteria by which you want to generate an interactive network, the actual network visualization canvas appears. To explain the basic interaction, we will use the following network: Rai Shizu, based on all events, group highlighting by gender (i.e. we only select Rai Shizu as the seed person and leave the other settings to default).1
General canvas
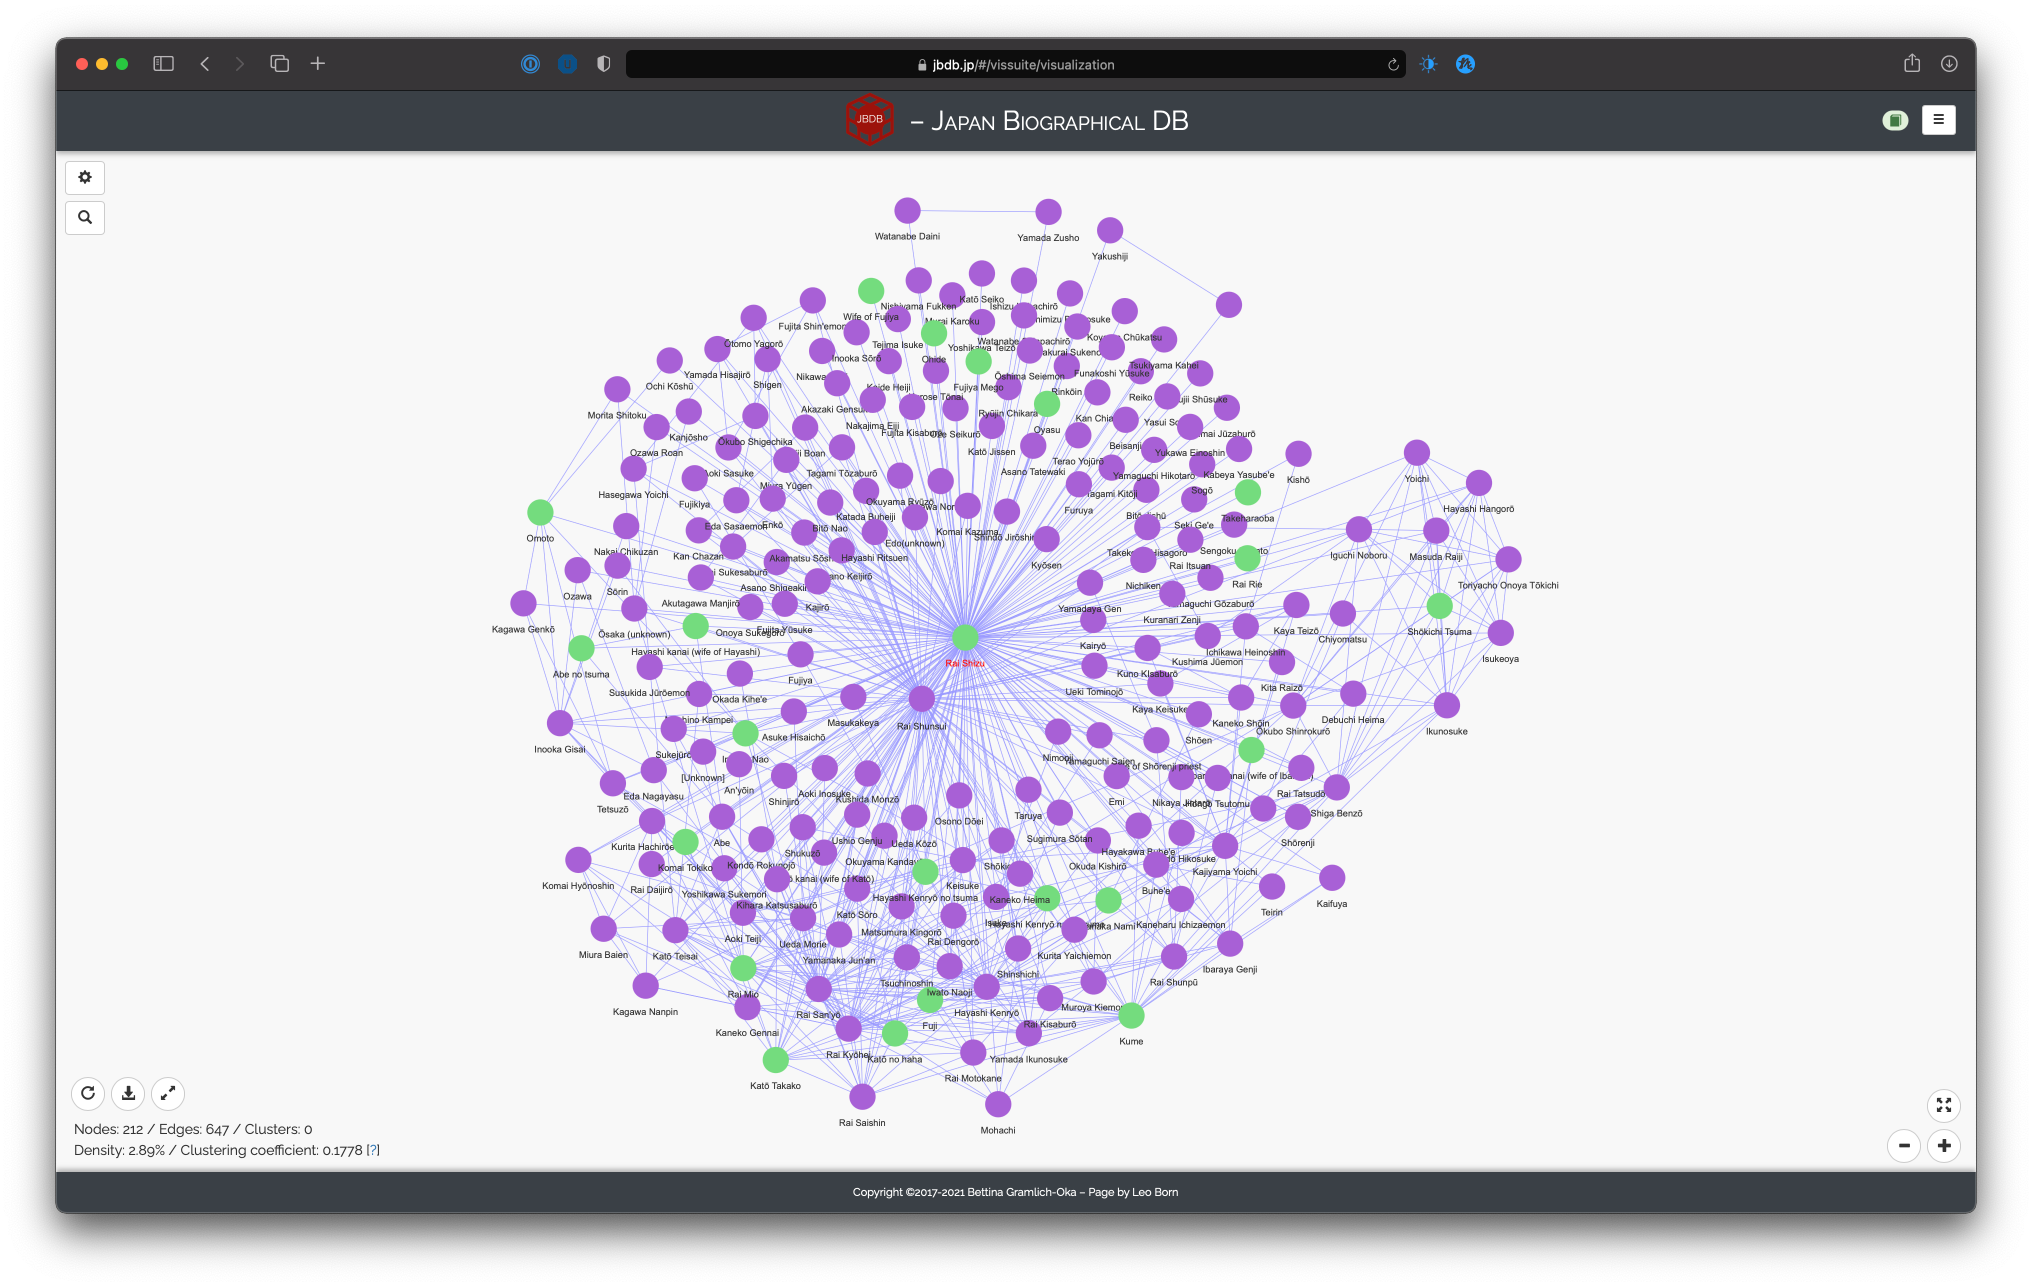
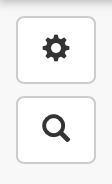
There are three sets of buttons on the canvas. Starting on the top left, there are the two buttons to access the settings menu and the search menu:
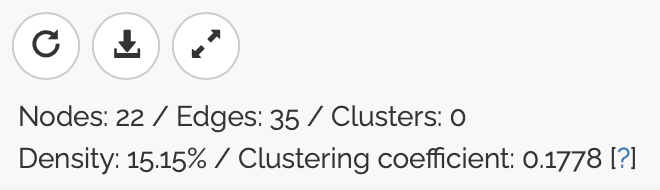
Next, on the bottom left, there are three buttons and some statistics on the network:
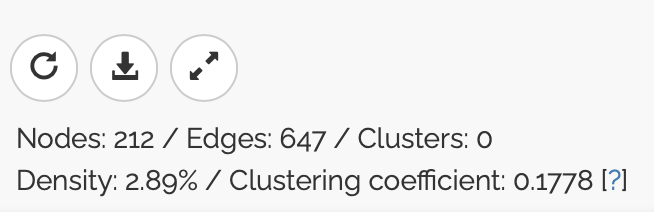
The buttons, from left to right, are for: resetting the layout (useful if you have moved a lot of nodes around and want the start layout), saving the network (just nodes and edges as shown/highlighted) as a PNG file (a modal opens where you specify the file name), and for displaying the network in fullscreen mode.
The statistics inform you about the number of nodes, edges, and clusters that are currently displayed. This is important as these numbers will change depending on how you manipulate the network (e.g. hiding all men, see below). Density is a percentage of actual edges to the number of maximally possible edges, i.e. if a network has connections for every pair of nodes, it would be maximally dense, whereas a network with no connections at all is not dense. The clustering coefficient measures the degree to which nodes cluster around each other. Technically, this is an approximation of the global clustering coefficient.
The last group of buttons appears on the bottom right:
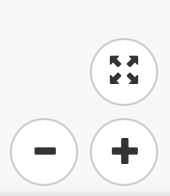
They serve to zoom in (plus sign) or out (minus sign) of the network, although the same effect can be achieved using a scroll wheel on a mouse. The top button simply centers the network on the canvas.
Generally, the network reacts both when you hover your mouse over elements and when you click on elements (either nodes or edges). Hovering over a node highiights its associated edges:
However, to delve into more detail on the highlighted part of the network, clicking on the node greys out all unconnected nodes and edges and reveals an information overlay window:
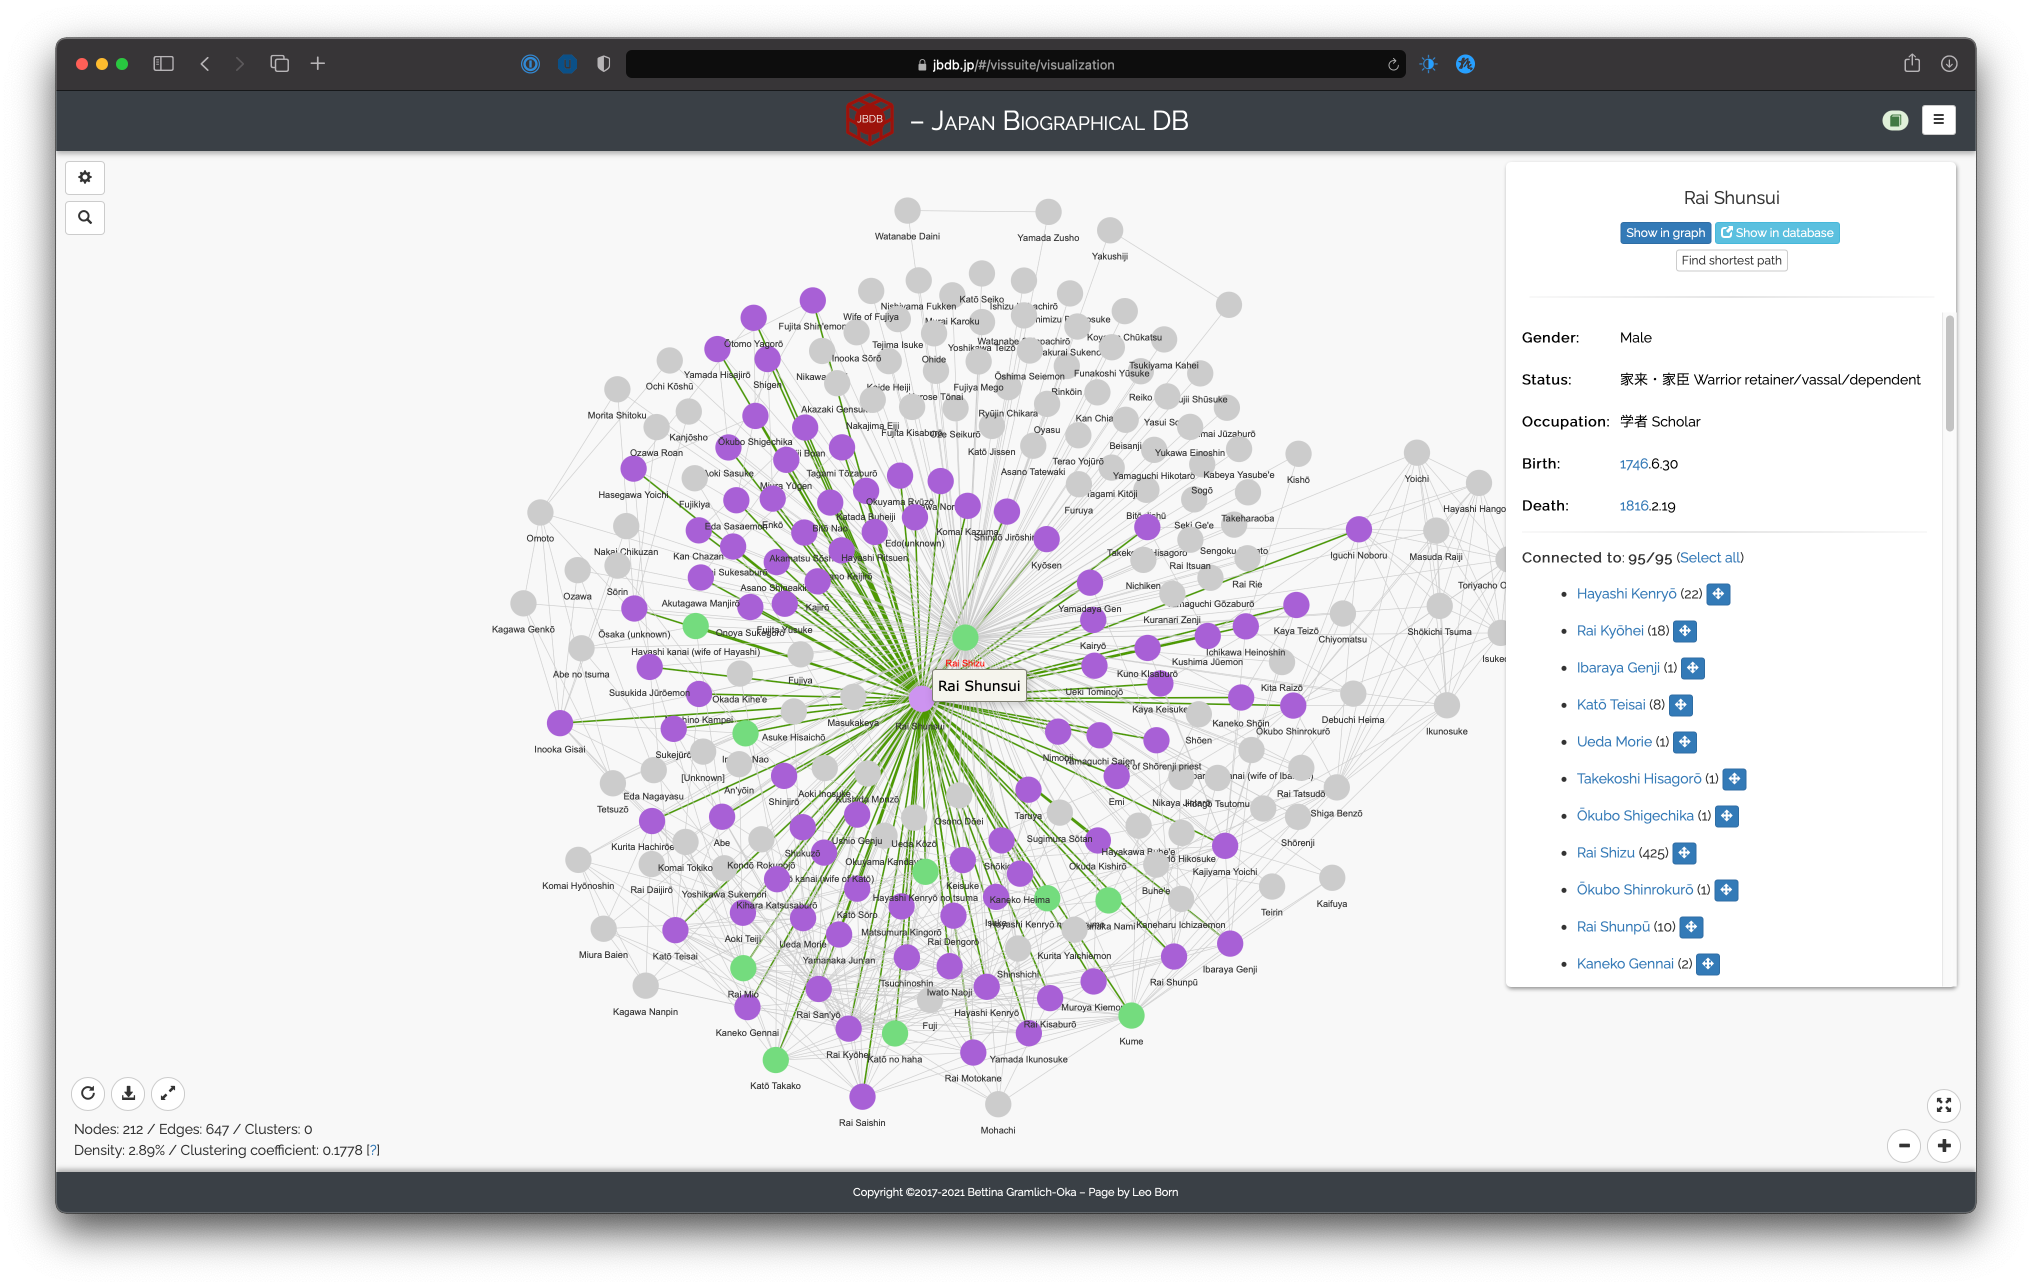
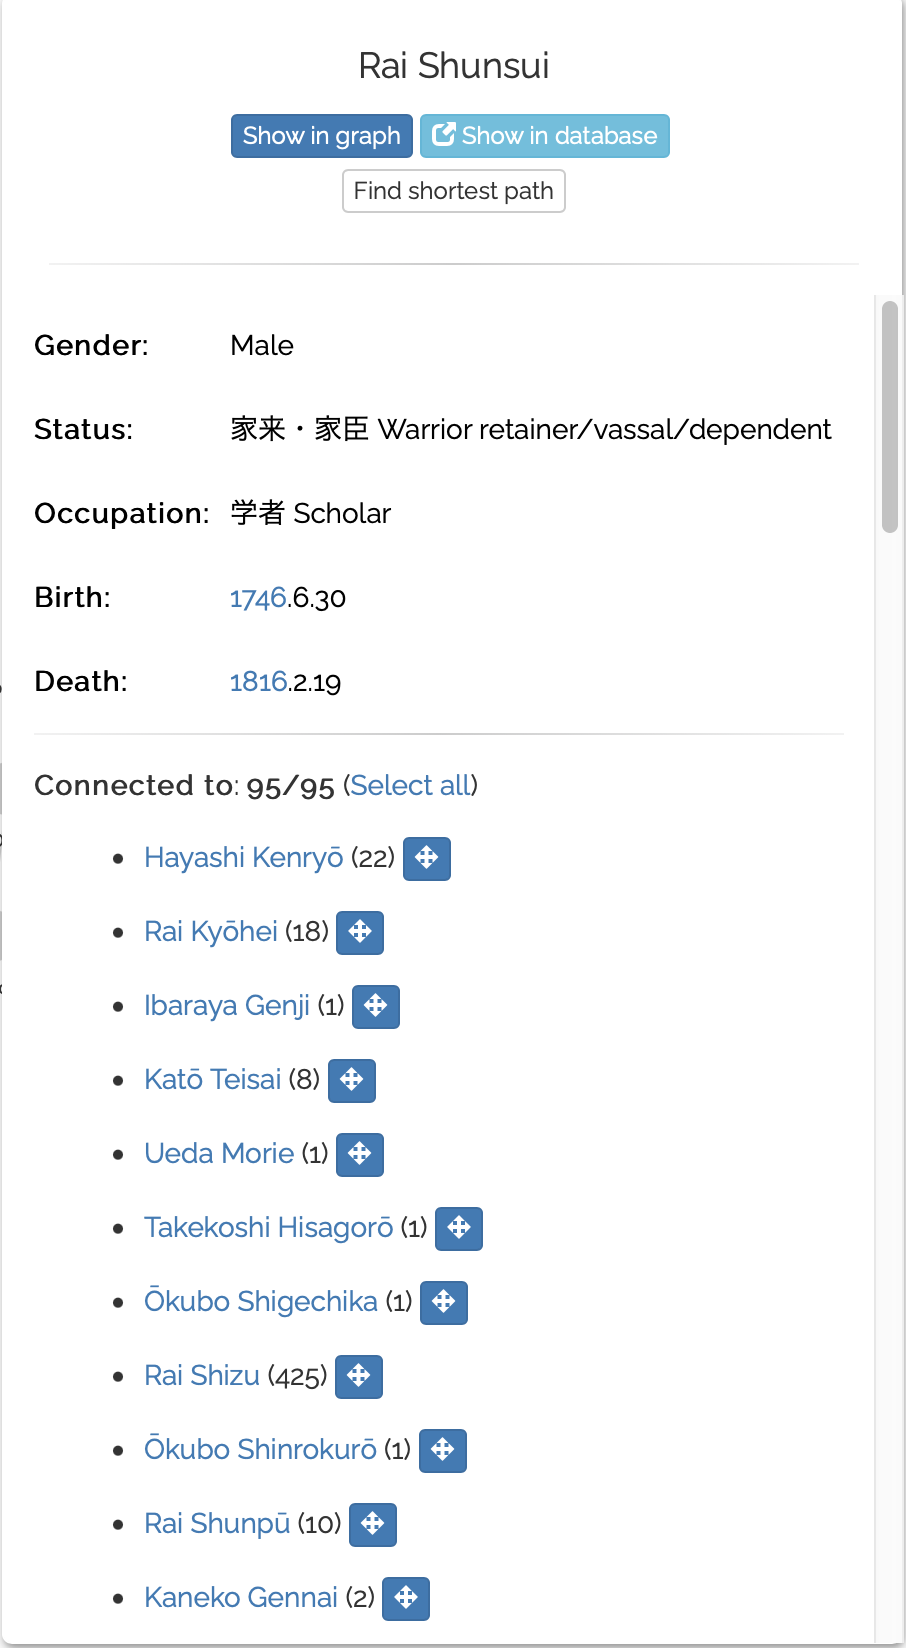
Basic overlay window
The overlay window shows some basic information on the selected person. It furthermore allows to zoom in on the selected person (“Show in graph”), show the main database entry in a separate tab (“Show in database”) and find the shortest path to any other person in the network, if applicable:
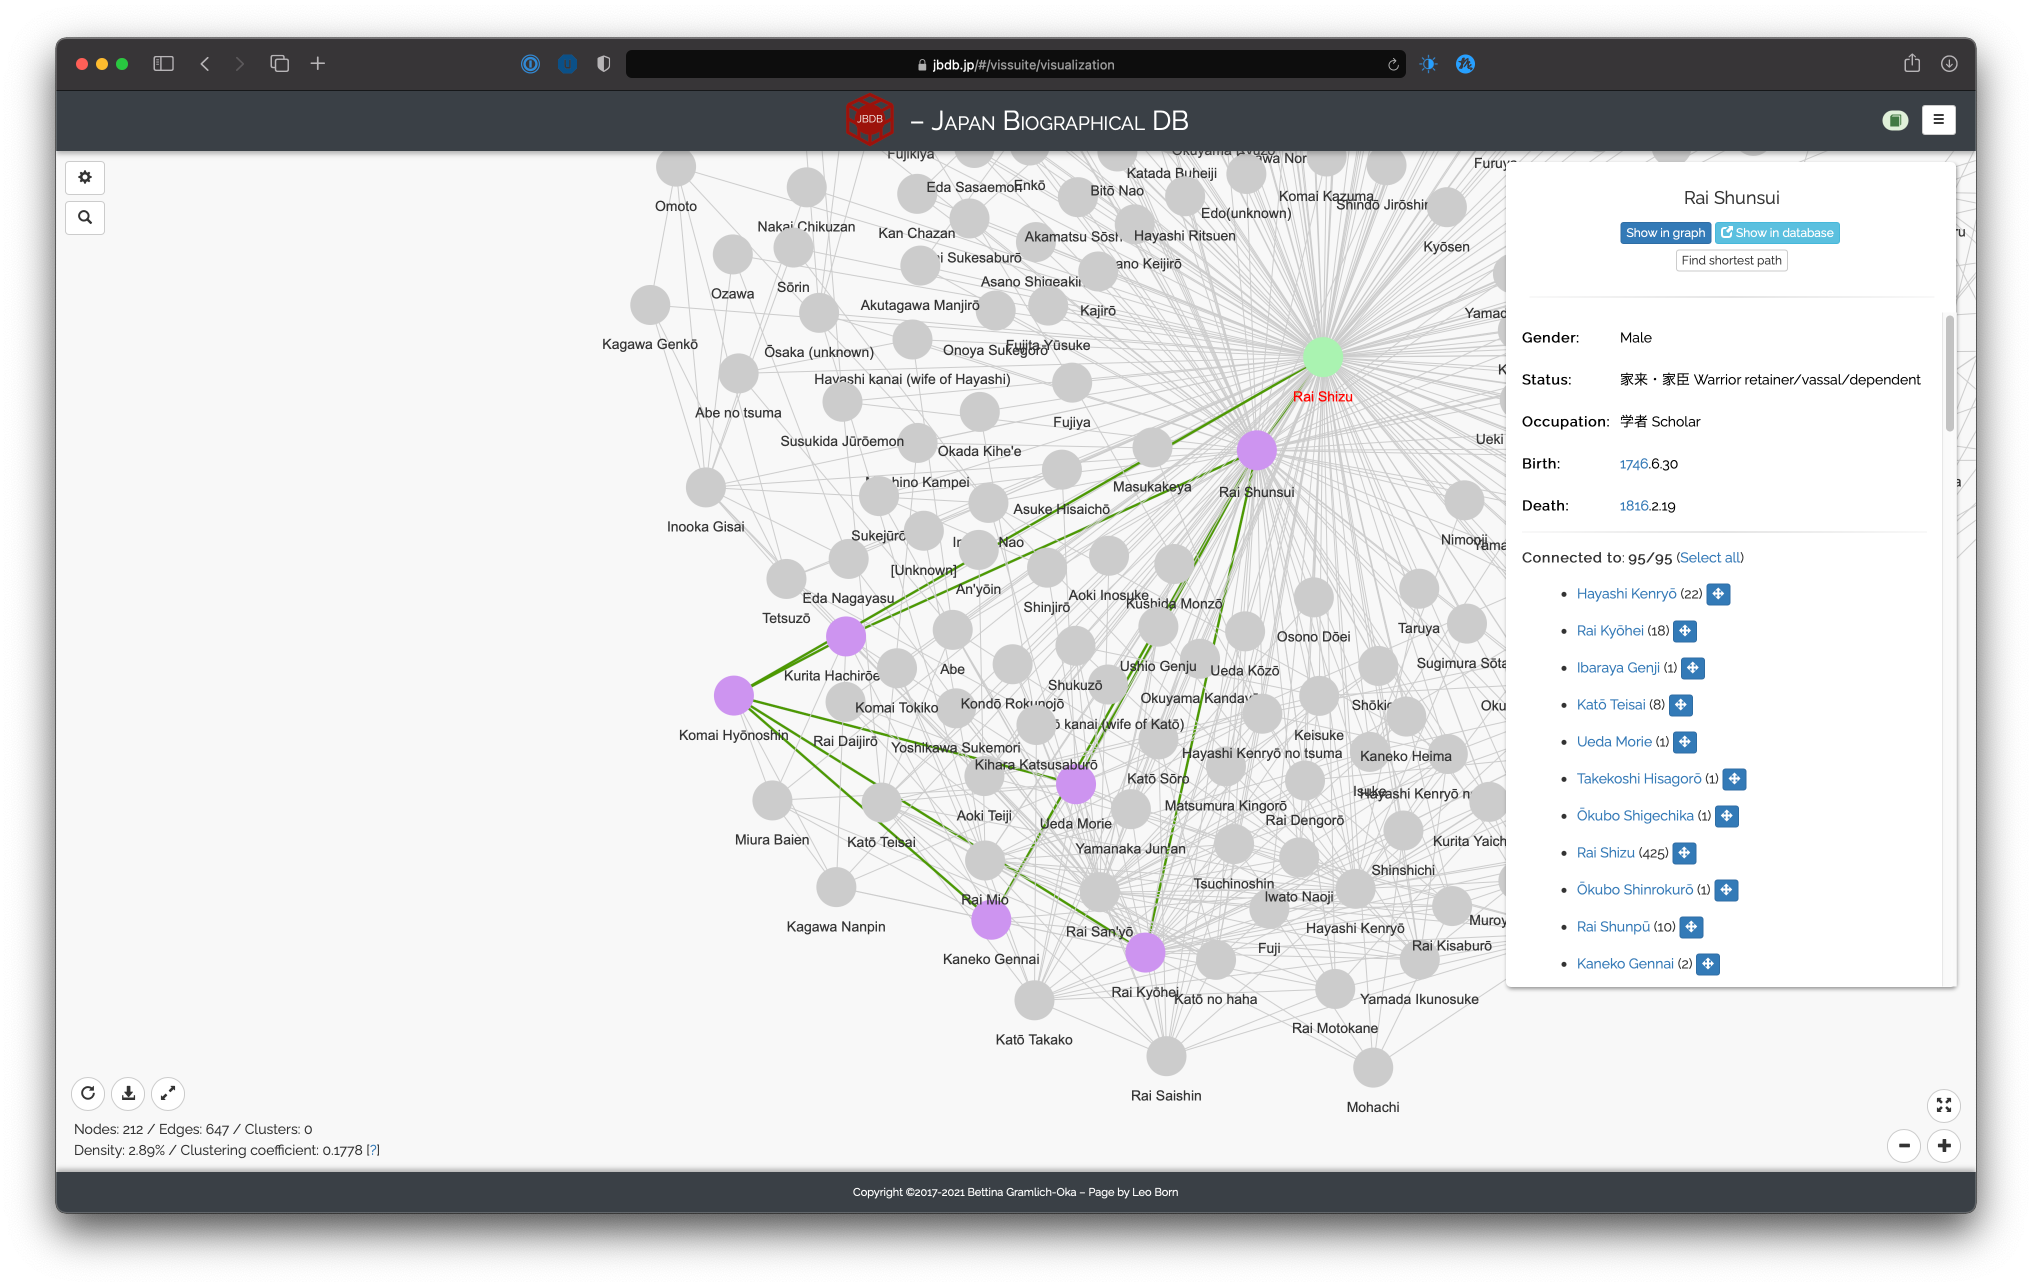
Shortest path
Finding the shortest path is useful in large networks, where not all persons are connected directly to each other but indirectly through common connections in between. Clicking on “Find shortest path” opens a modal window with a search bar and all other persons in the network. Selecting one person, we can now highlight the found path by clicking “Find”:
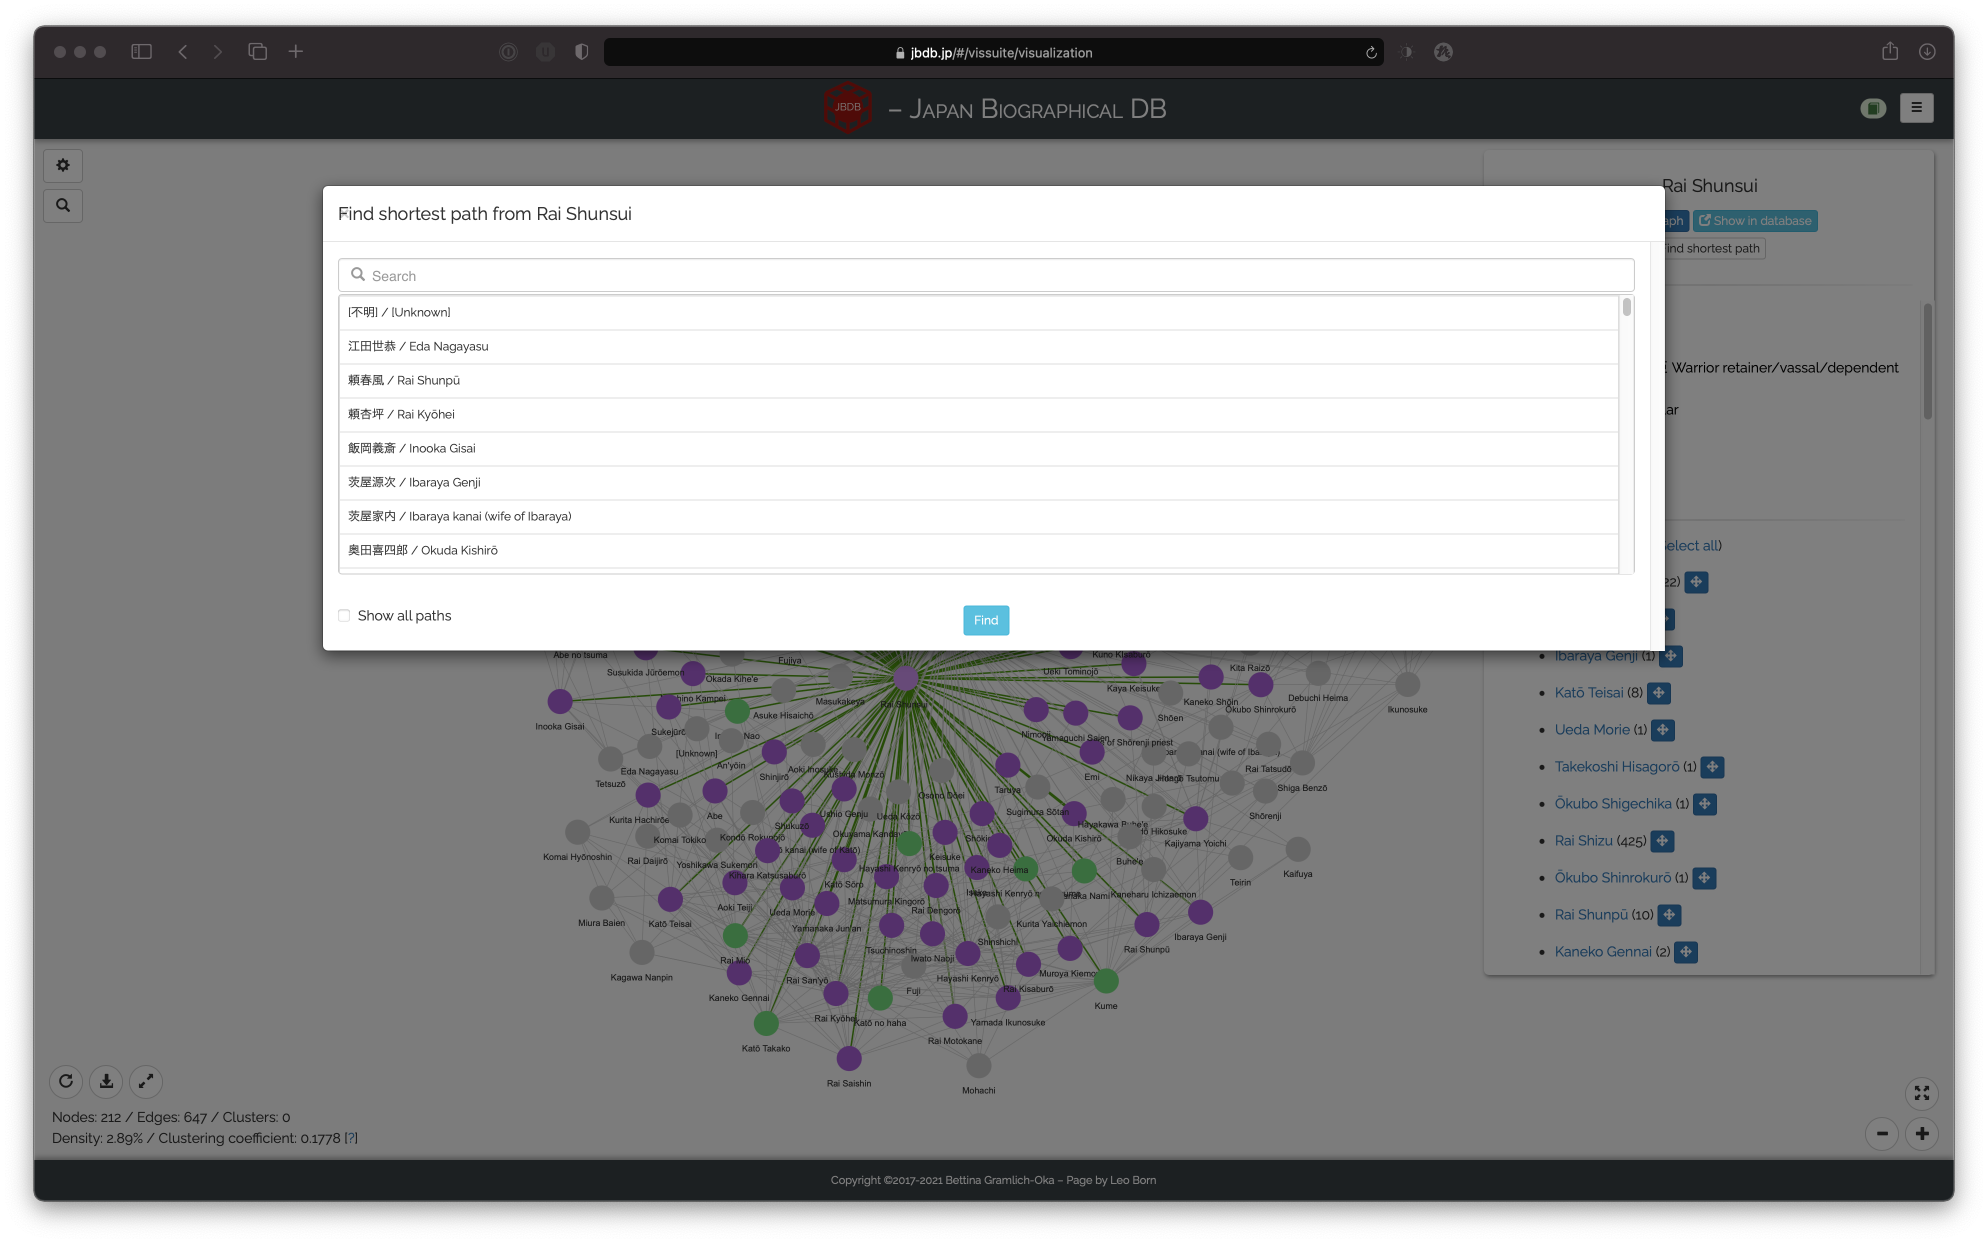
Sometimes there are multiple equally short paths between nodes; to highlight all, select “Show all paths”:
Connecting events
The network as shown is based on events (see above). In order to gain a better understanding about which events are underlying the connections, you can refer to the “Connected to” list in the lower part of the overlay window. It shows how many persons the selected person is connected with (here, 95) and lists them with the number of events connecting them in brackets (e.g. Rai Shunsui has 22 events together with Hayashi Kenryō). The cross next to a person’s name allos you to center the canvas view on that person. Clicking on a person’s name, however, opens a modal window showing a table of the events underlying the connection:
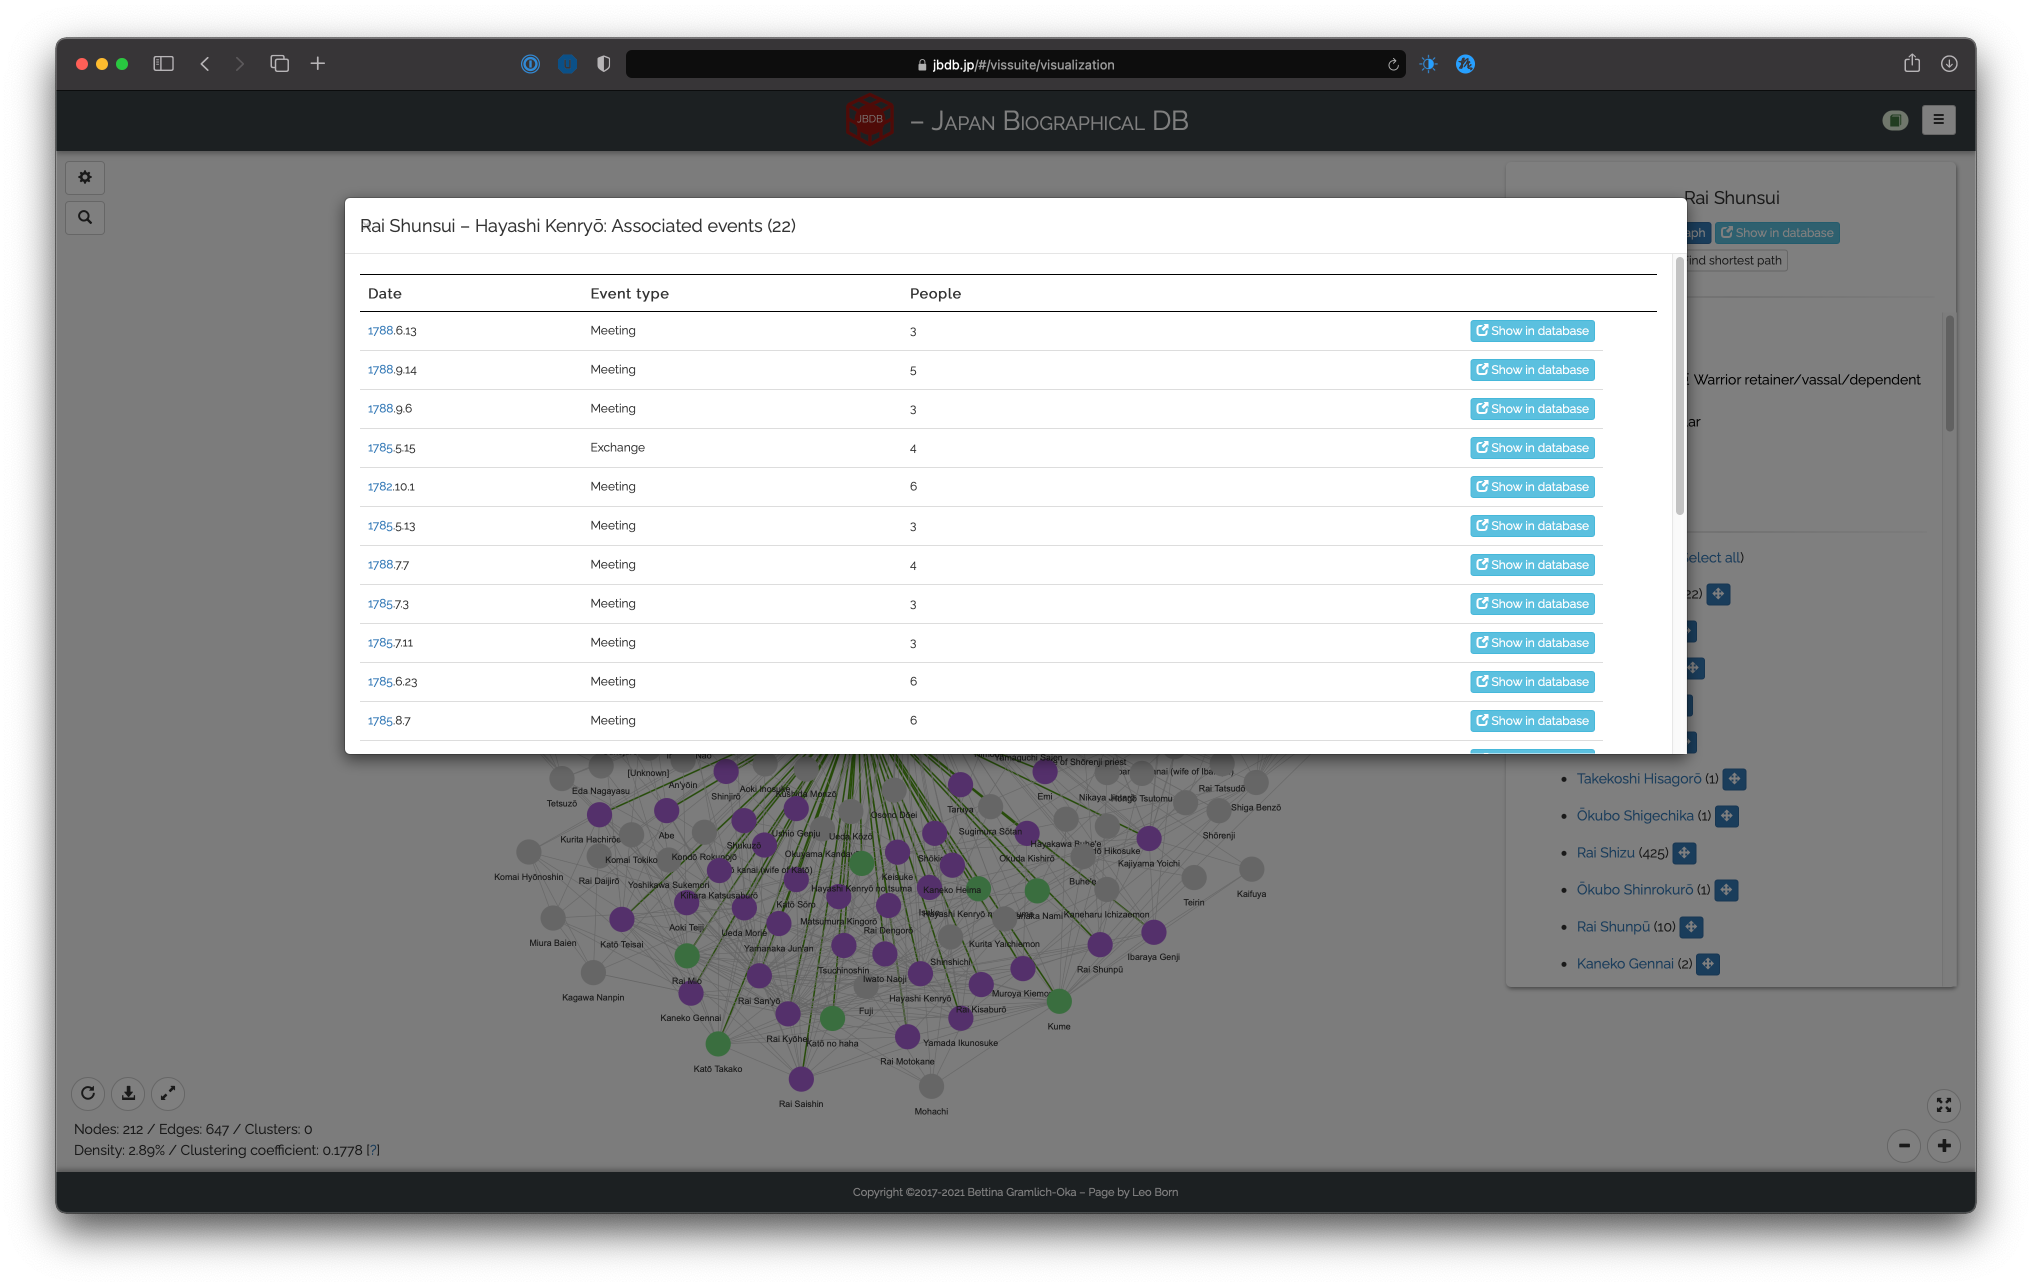
To avoid loading too much data, the default is to show only the top 50 events. If there are more than 50 events, below the table appears a “Load more” button, allowing to show 50 more events. The table shows only rough information: date, type (Meeting/Exchange), and number of people. If you are interested in more details on any one event, clicking on “Show in database” will open a separate tab with the event’s detail page. Note that clicking on an inidividual edge results in the same modal window (this, however, might not be advisable, depending on the size and density of the network).
Settings menu
The settings menu can be accessed using the gear symbol on the top left of the canvas and looks like this (split into two images, because it is large):
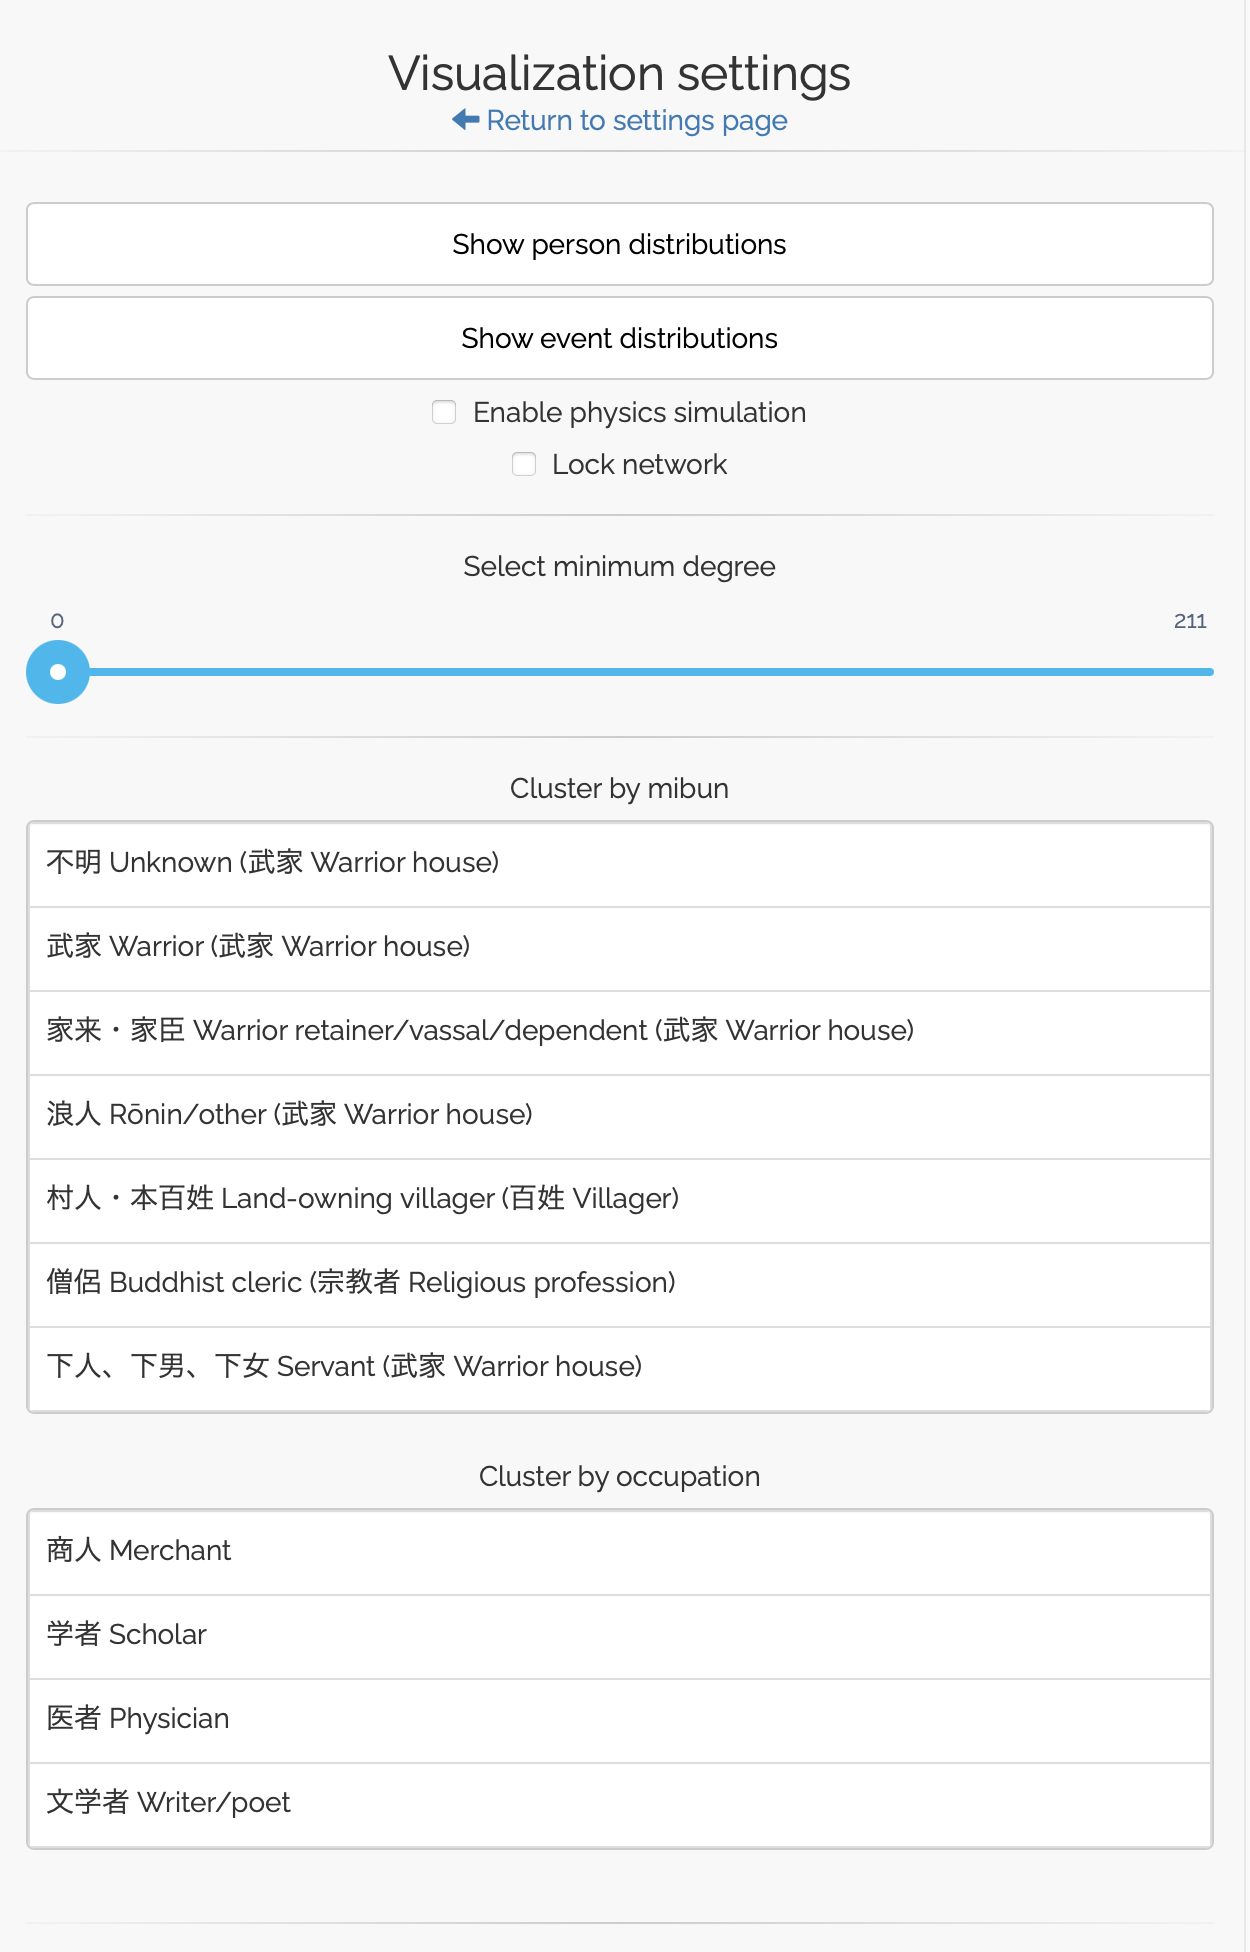
The top part contains the title and the link back to the front settings page. The next part allows accessing some distributional information on the network and two settings. Both settings are off per default. The first setting, “Enable physics simulation”, allows the network to react on you dragging nodes in the network and automatically re-arranging the layout of the network. Since it is off per default, if you drag a node, it stays where you leave it, allowing you to manually arrange the nodes:
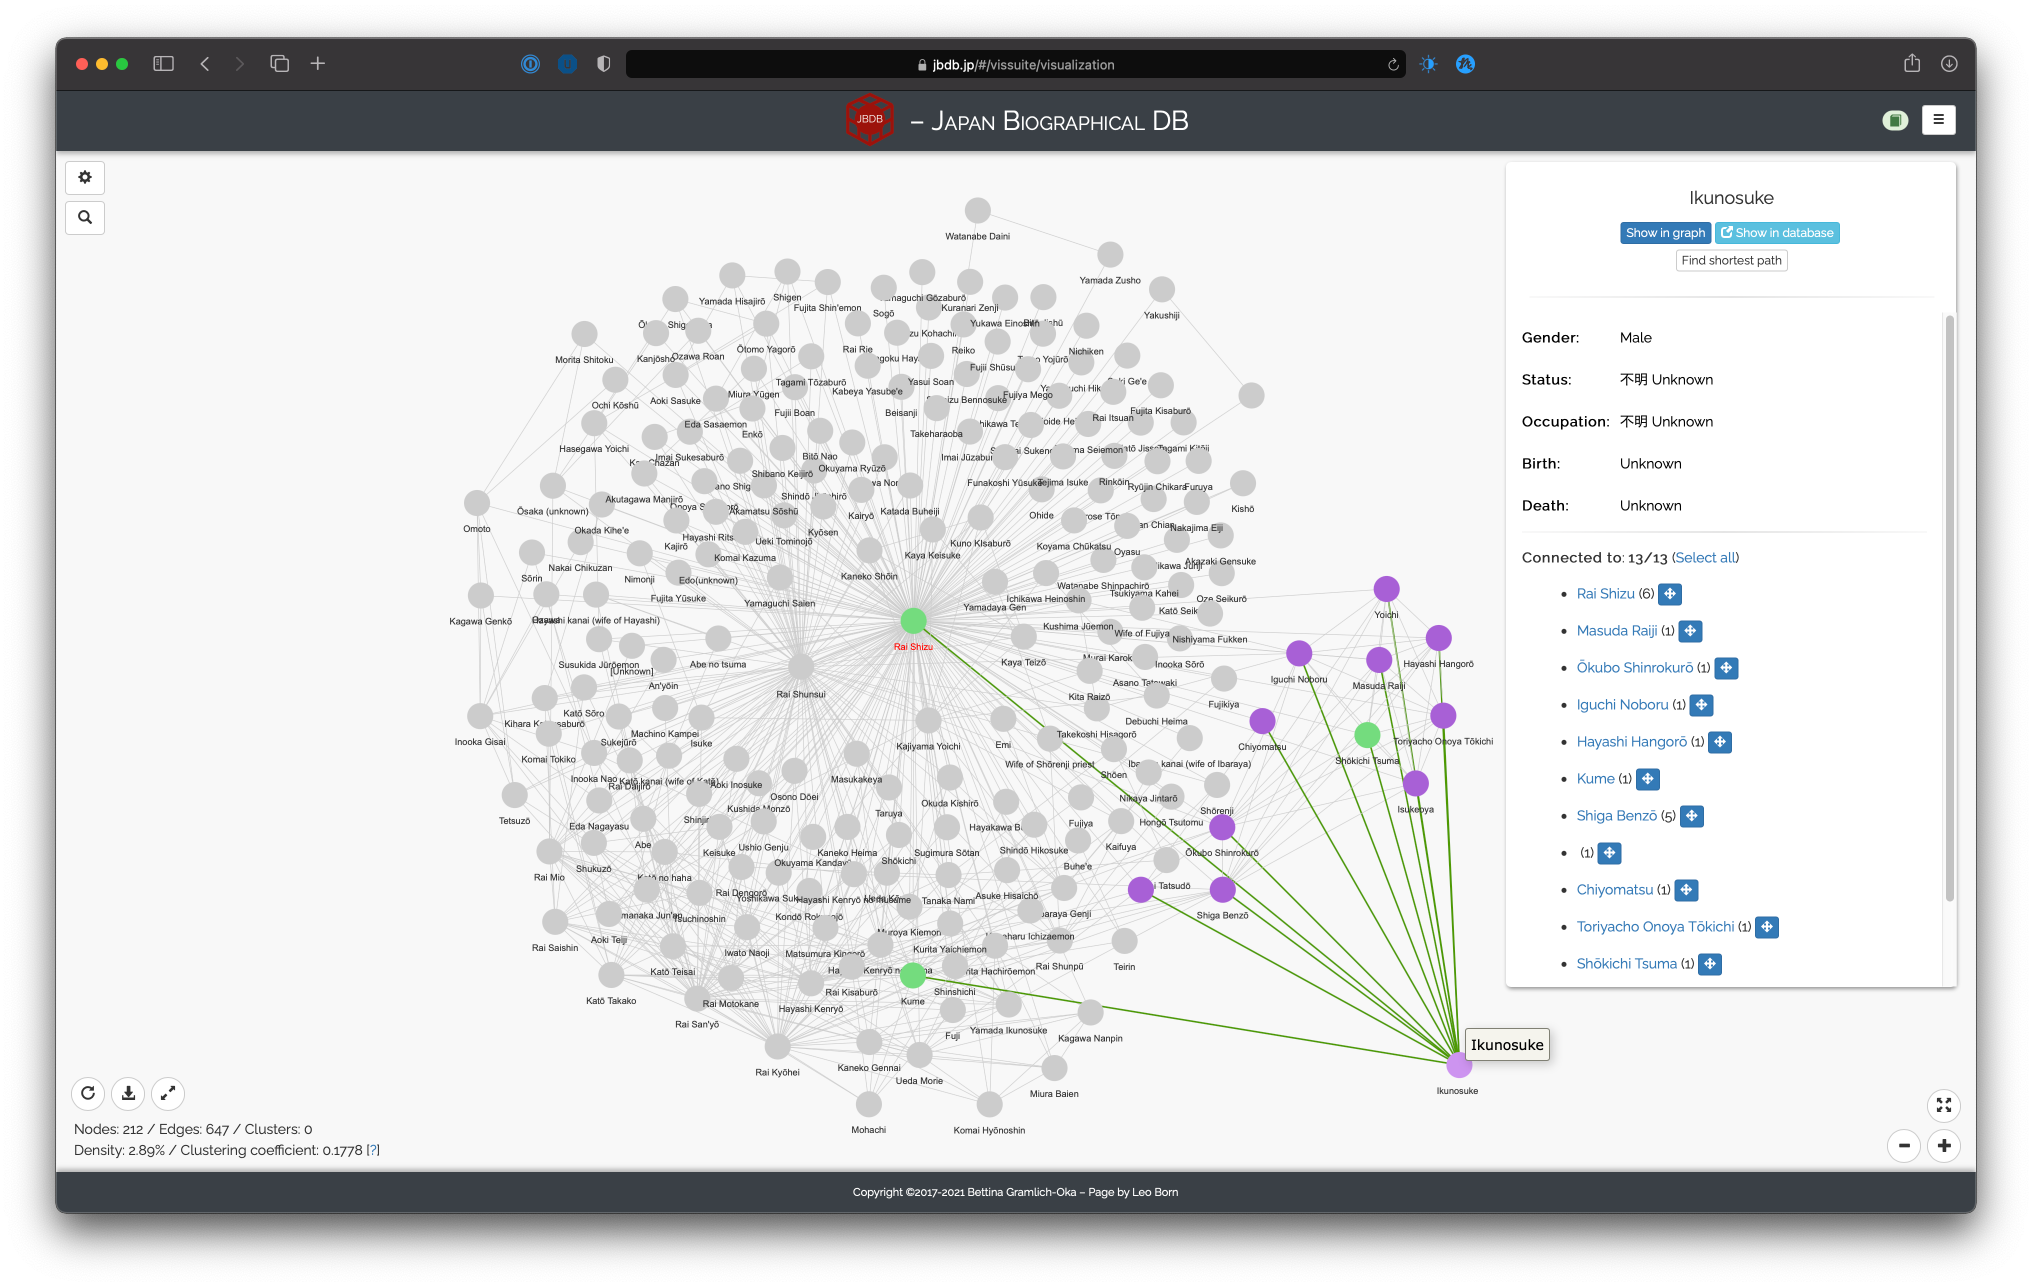
The second setting, “Lock network”, makes it so that clicking on a node or edge does nothing anymore (not showing the overlay window of the clicked person or not showing the event modal for the clicked edge). This is useful if you select a sub-part of the network and want to inspect it more closely or move around the highlighted nodes without running the risk of clicking something that might unhighlight them again. It also allows for rearranging groups:
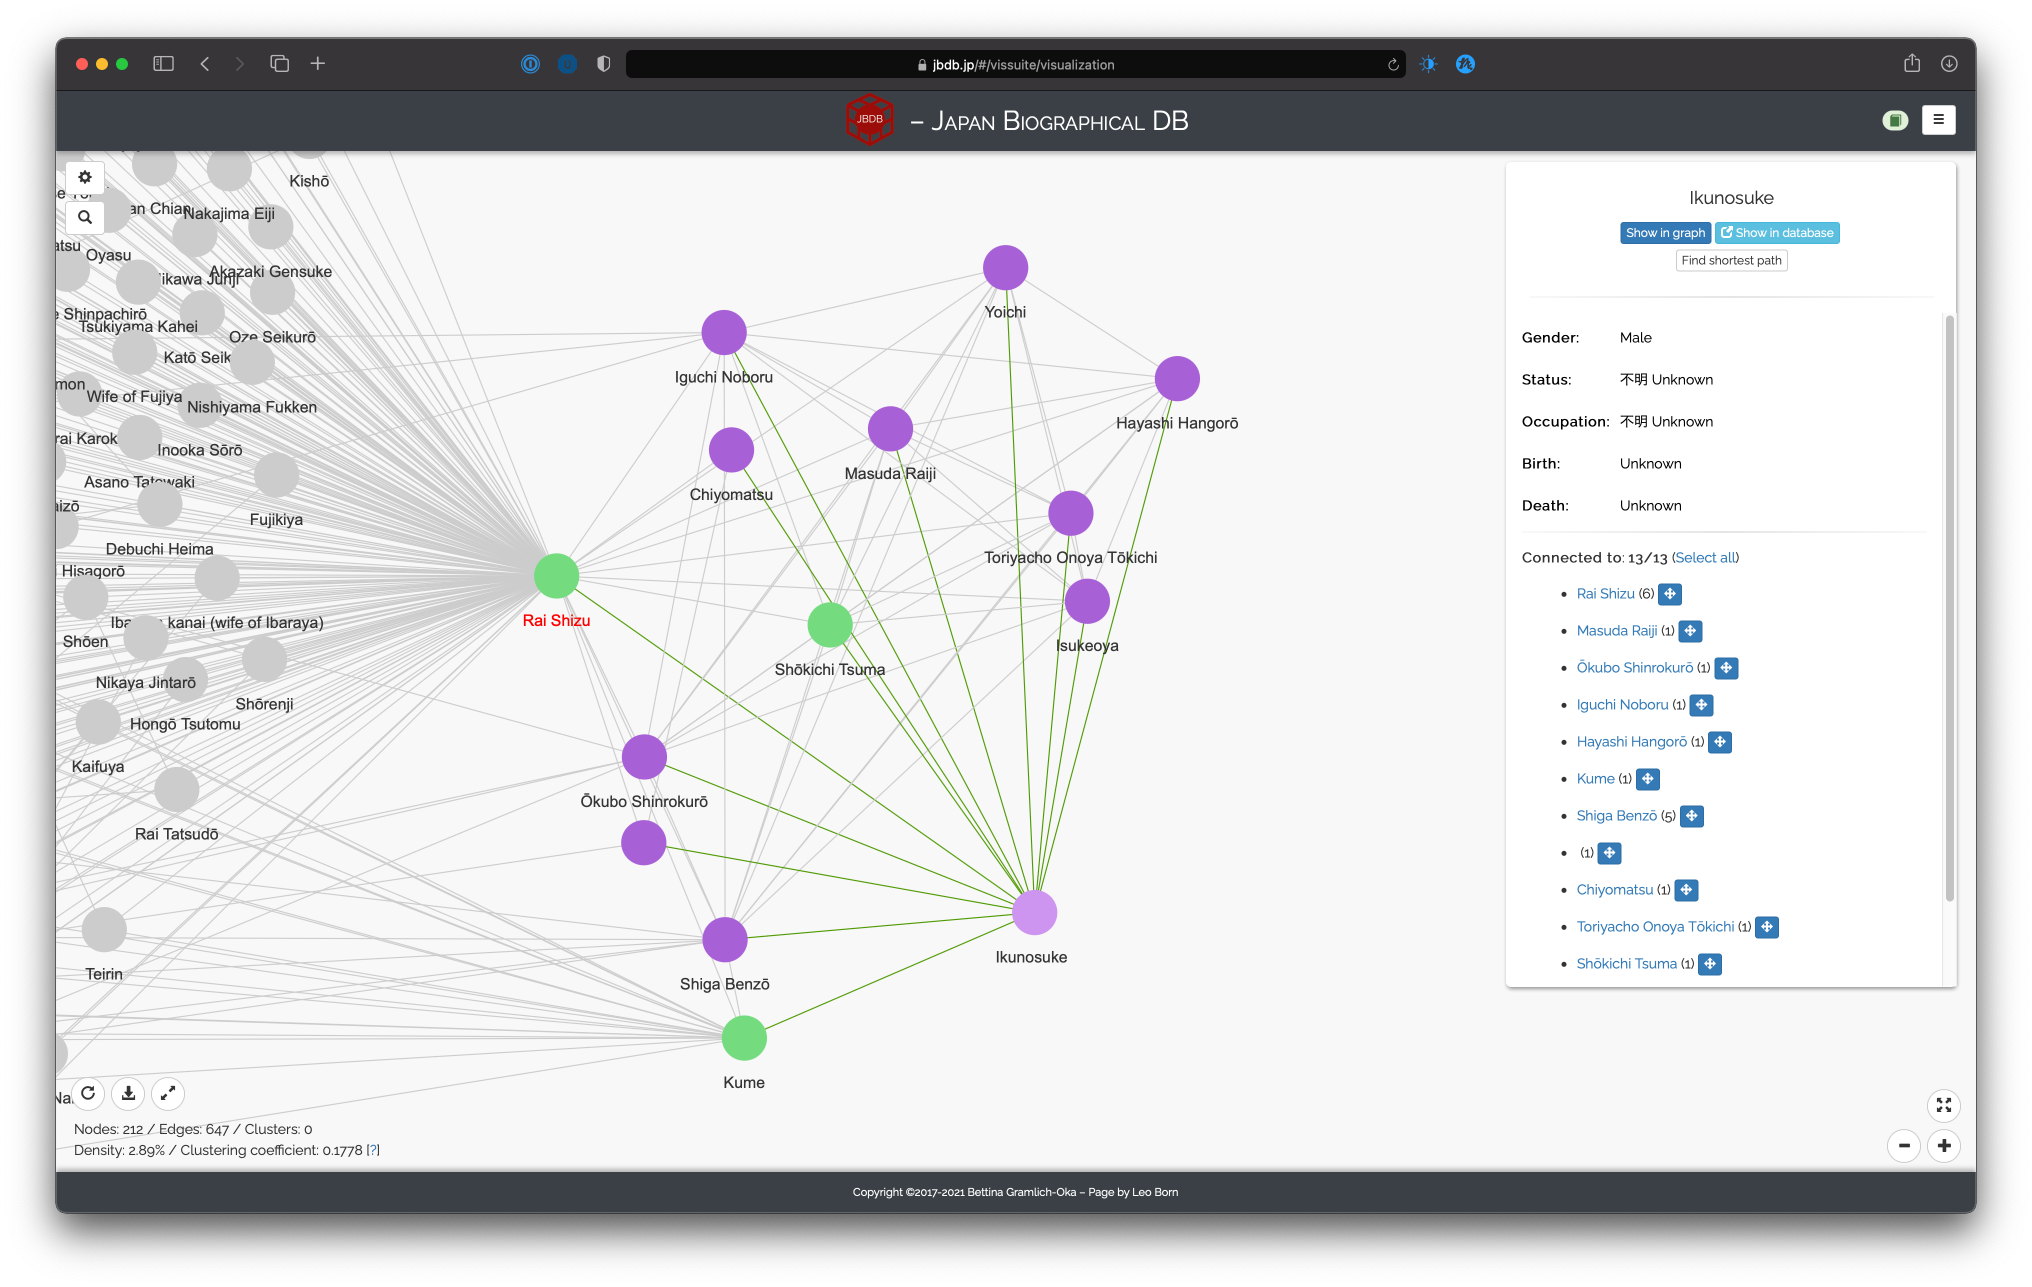
Note that we selected Ikunosuke, then clicked on “Lock network” and then re-arranged all of his connections.
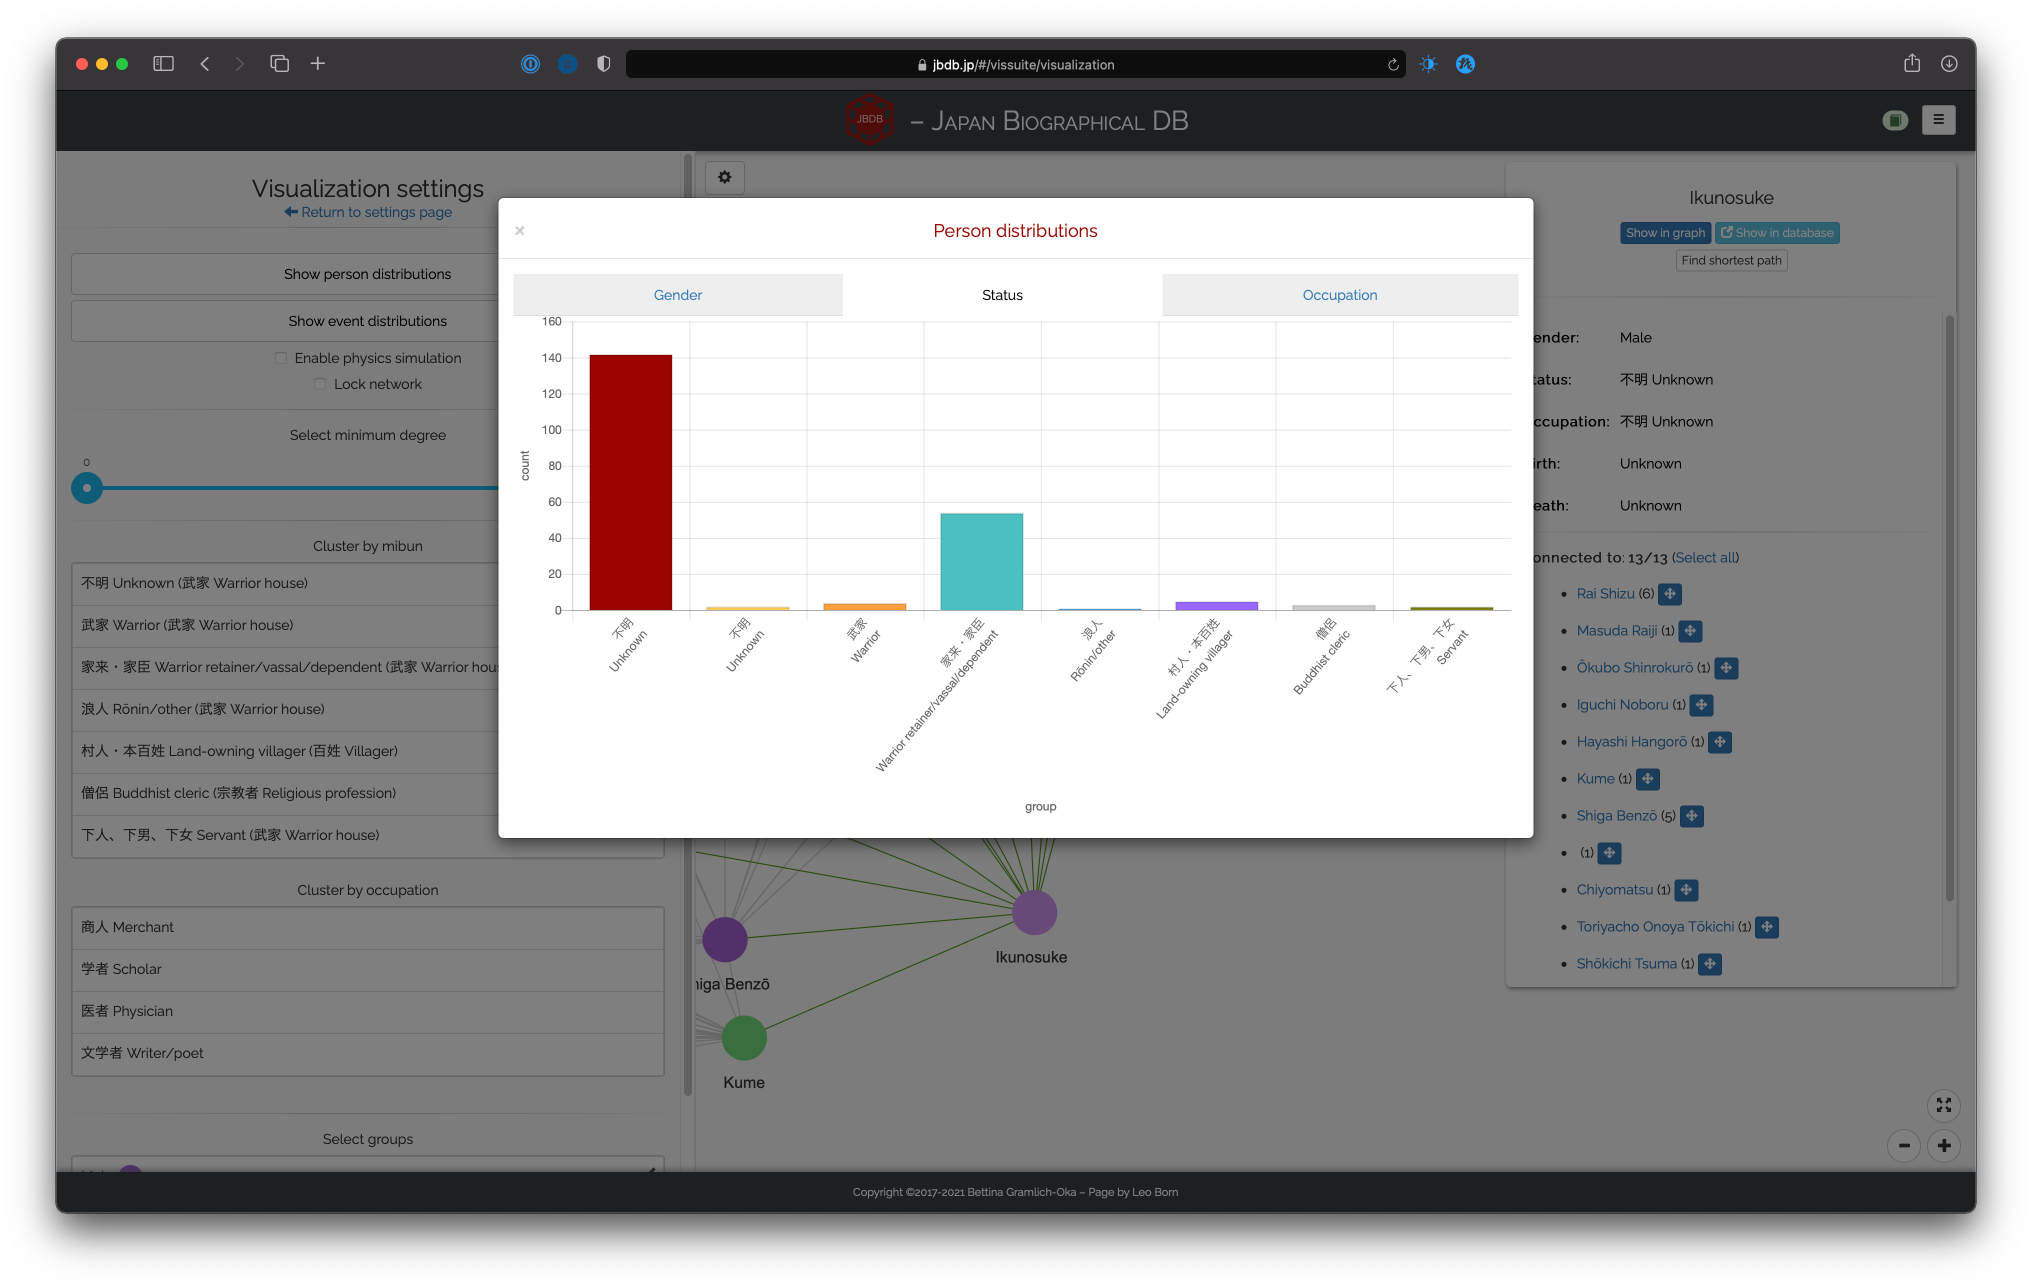
Person distributions
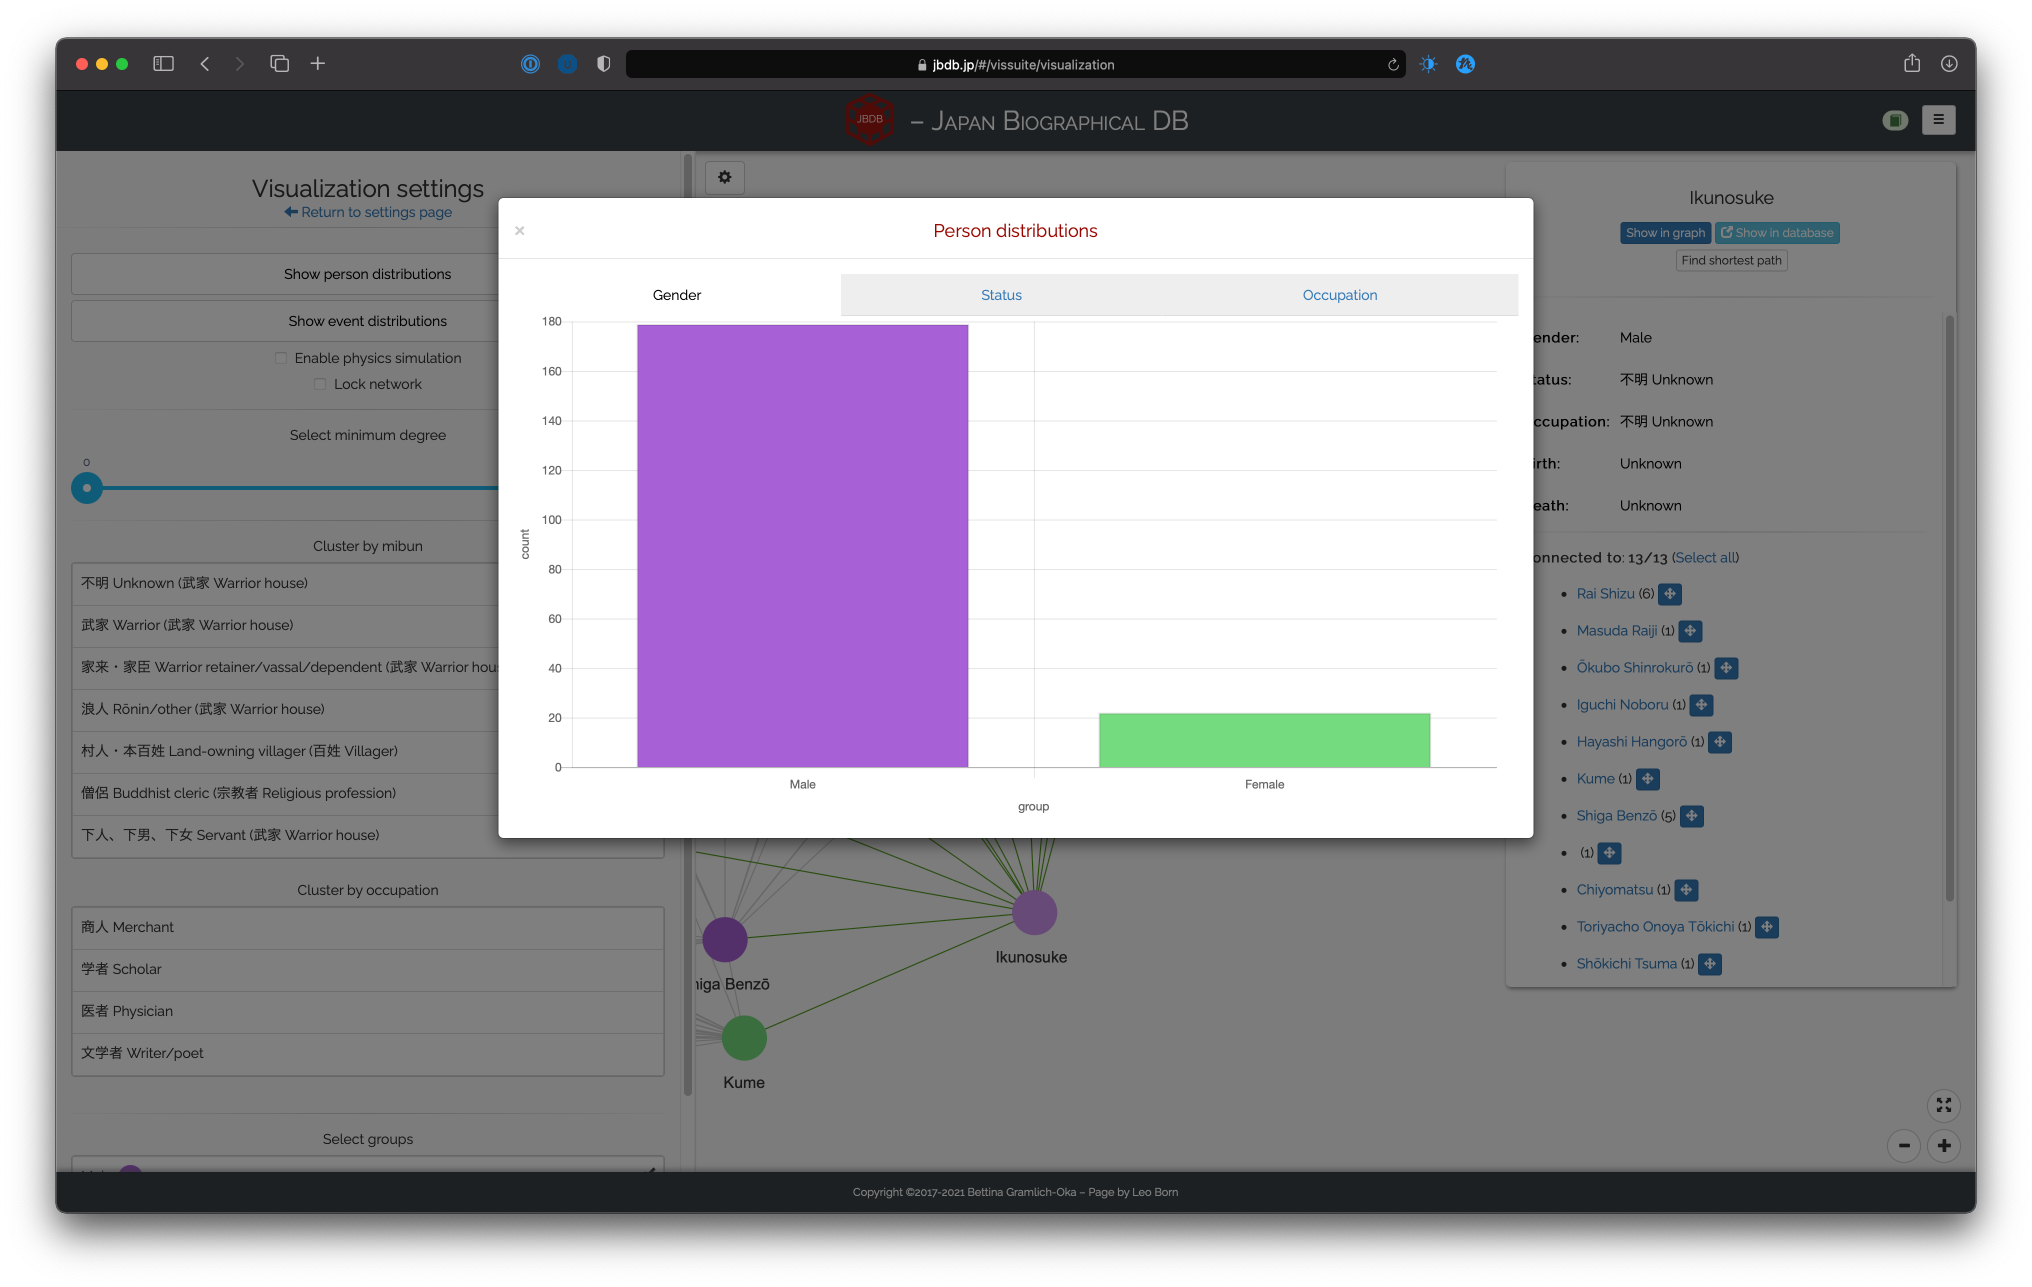
The other two options of this part of the settings menu allow you to display distributional information on the network. The first such distribution is concerned with the persons. It is split into three tabs, showing information on persons’ 1) gender:
2) statuses:
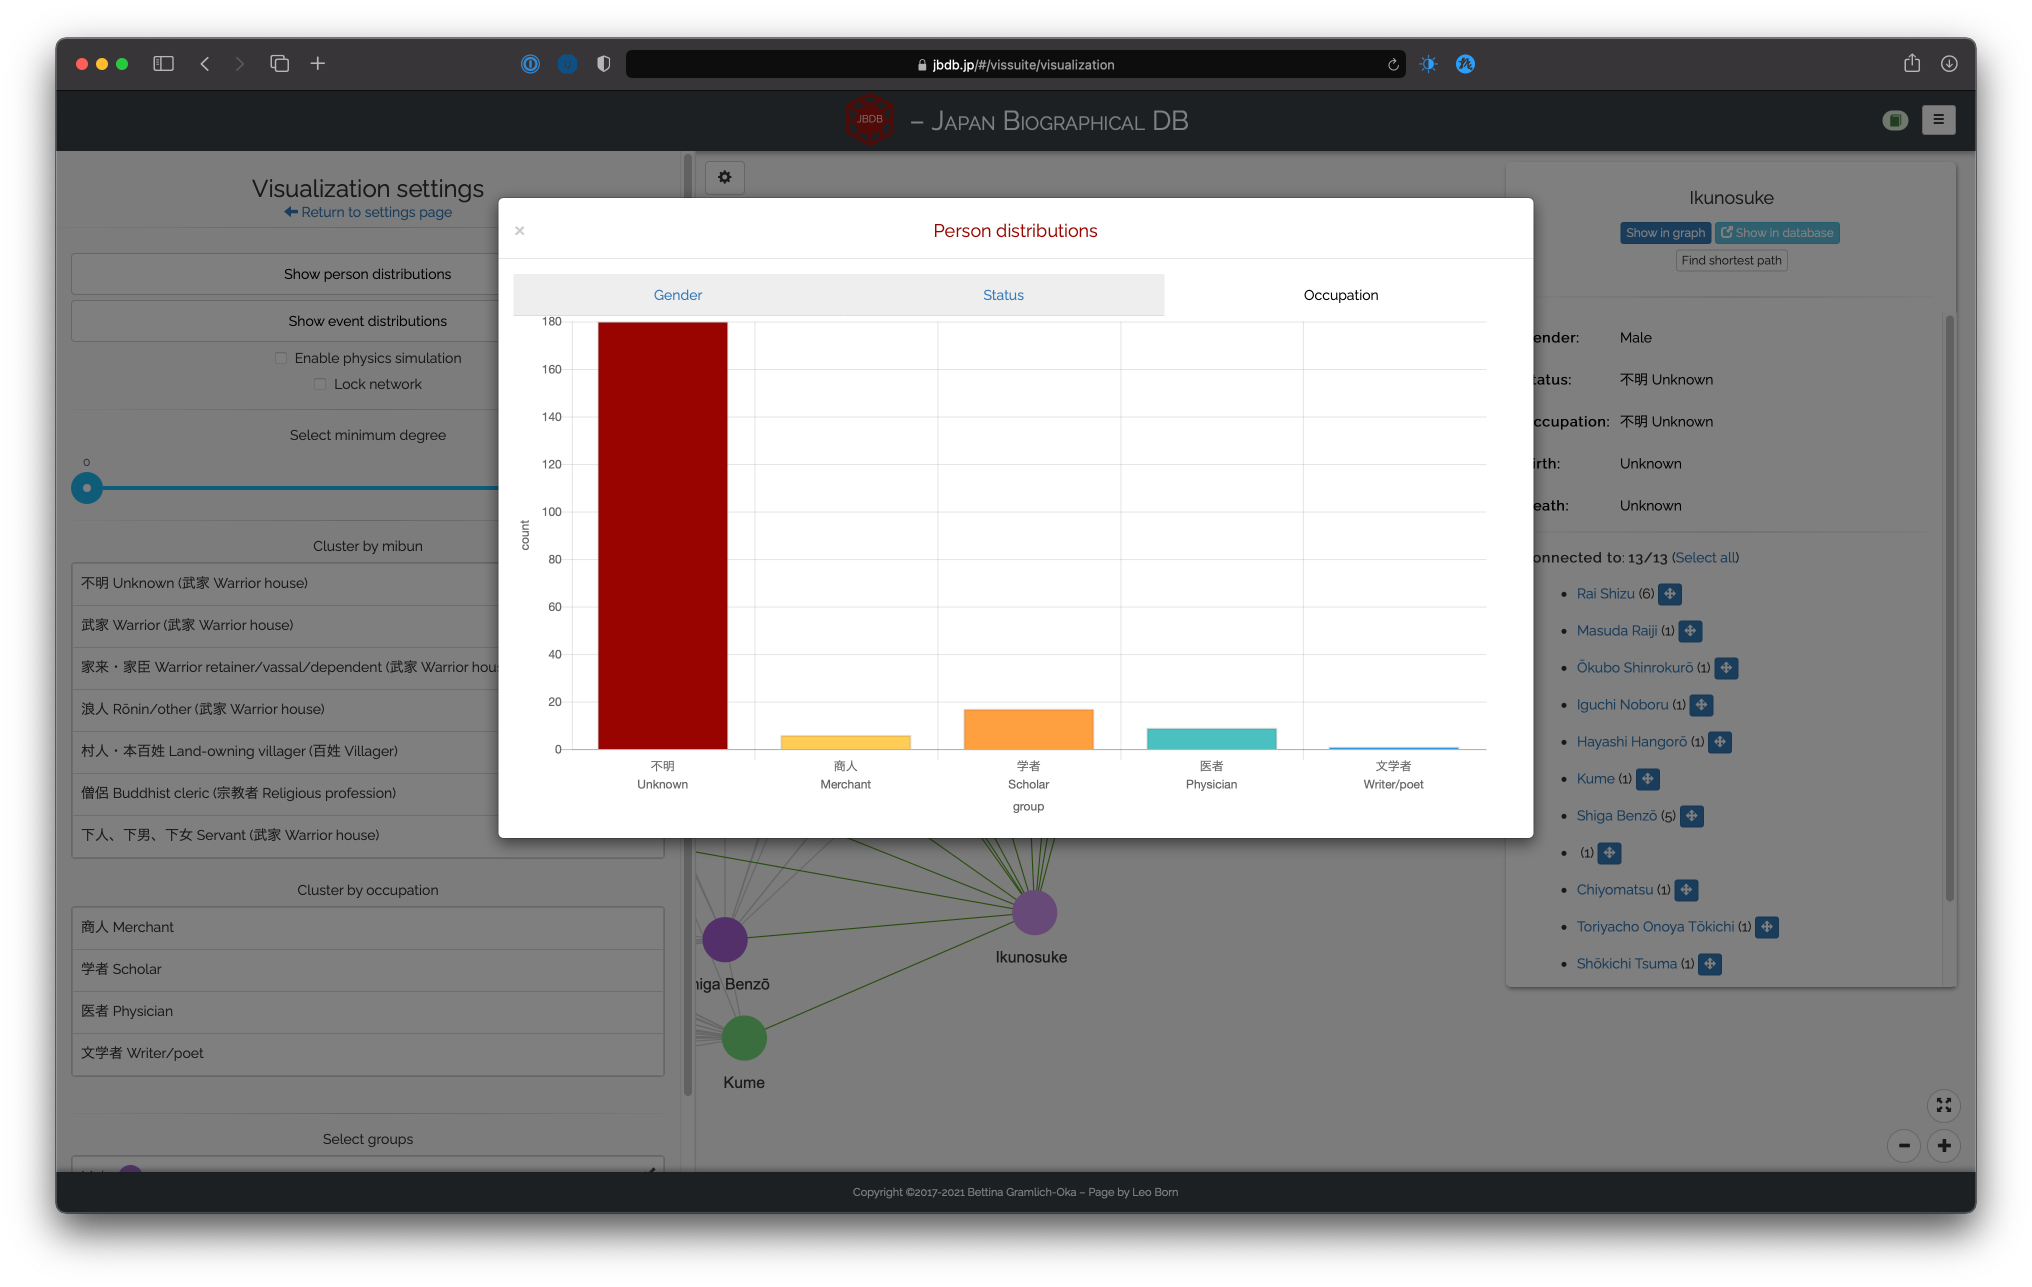
and 3) occupations:
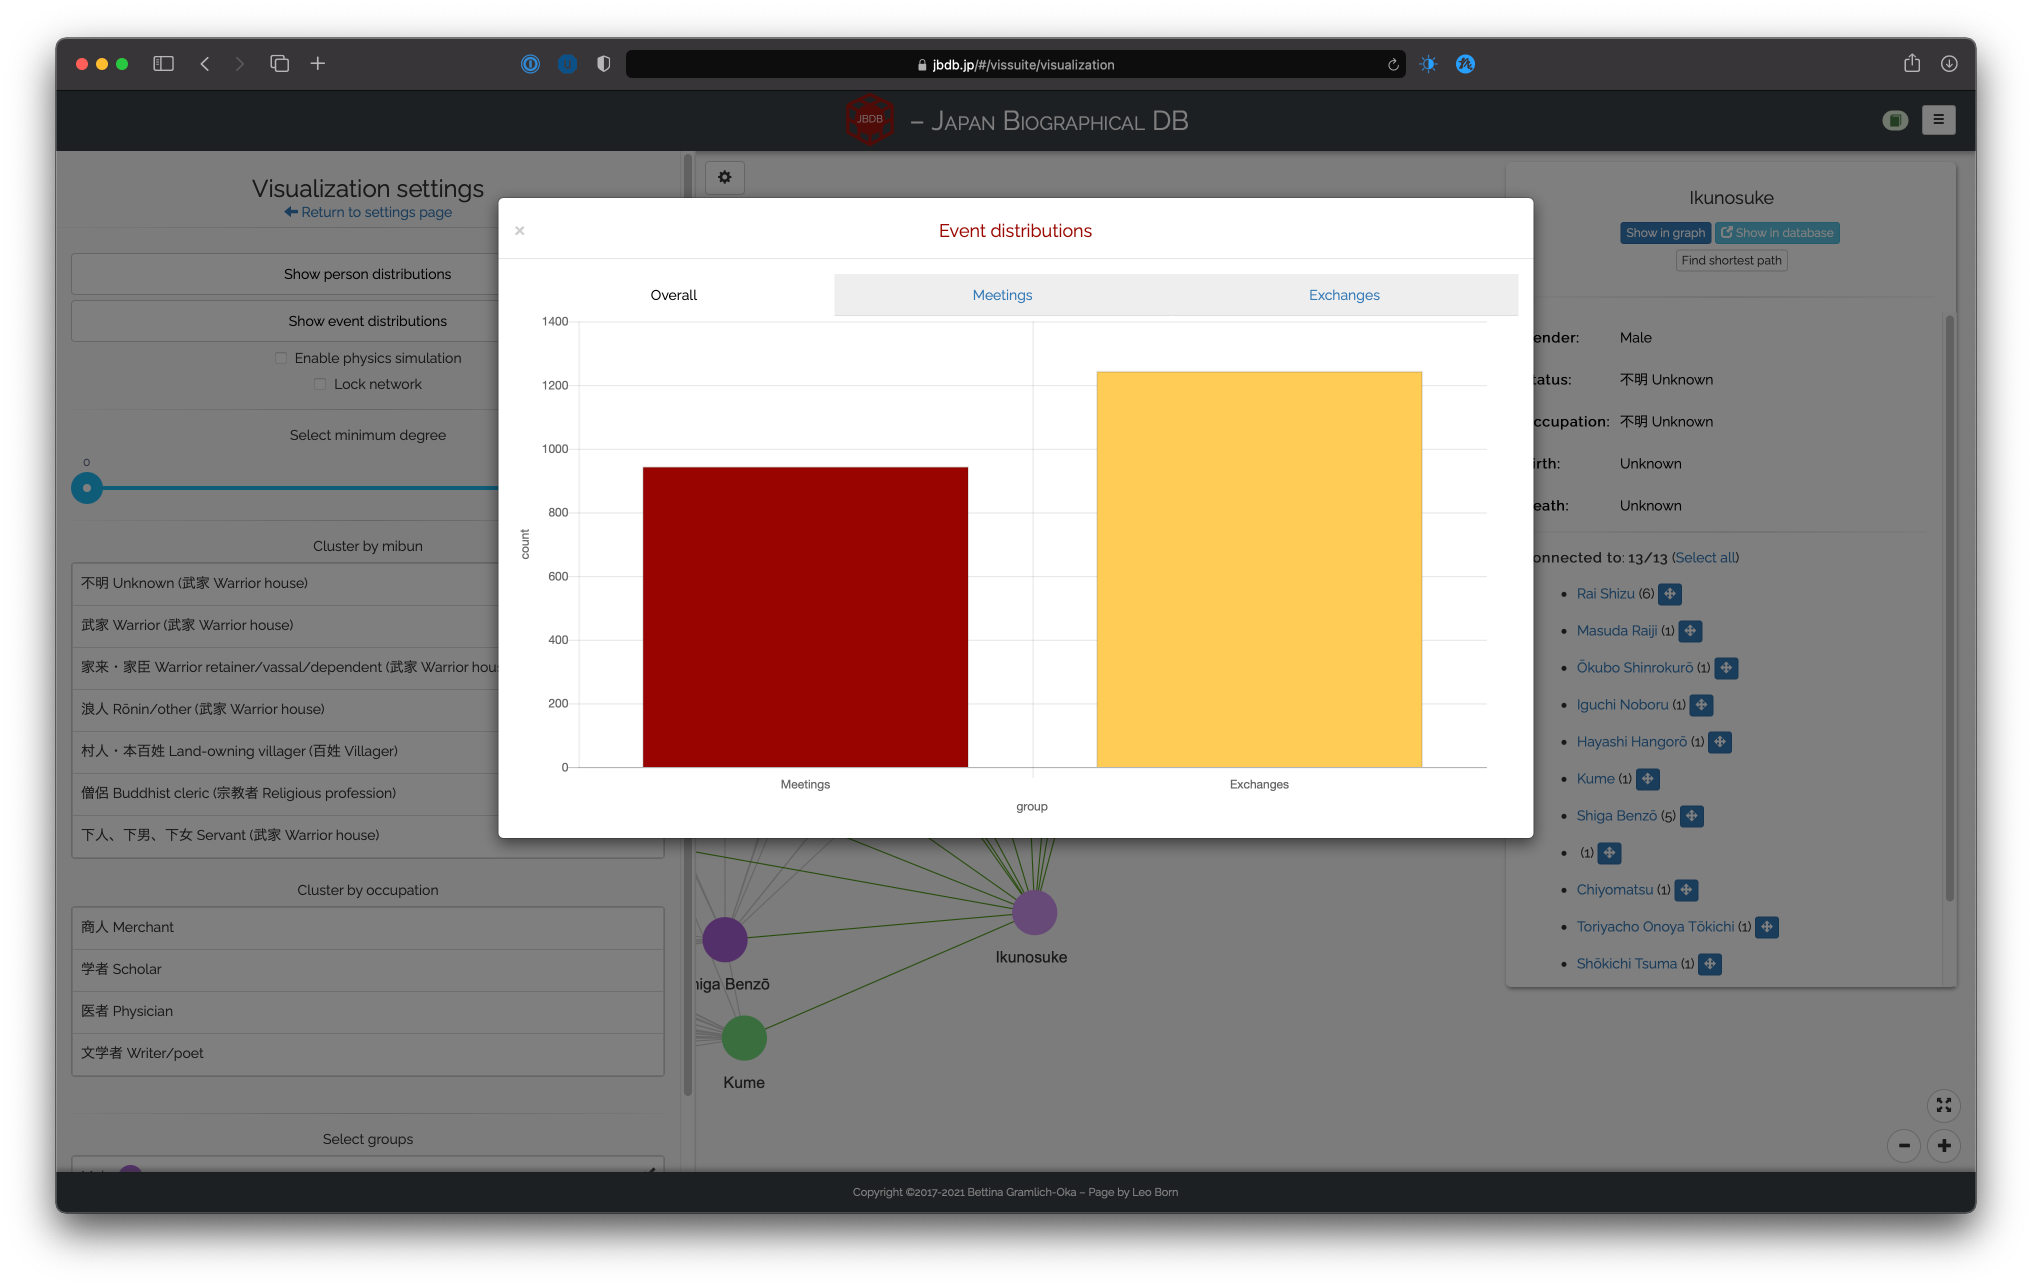
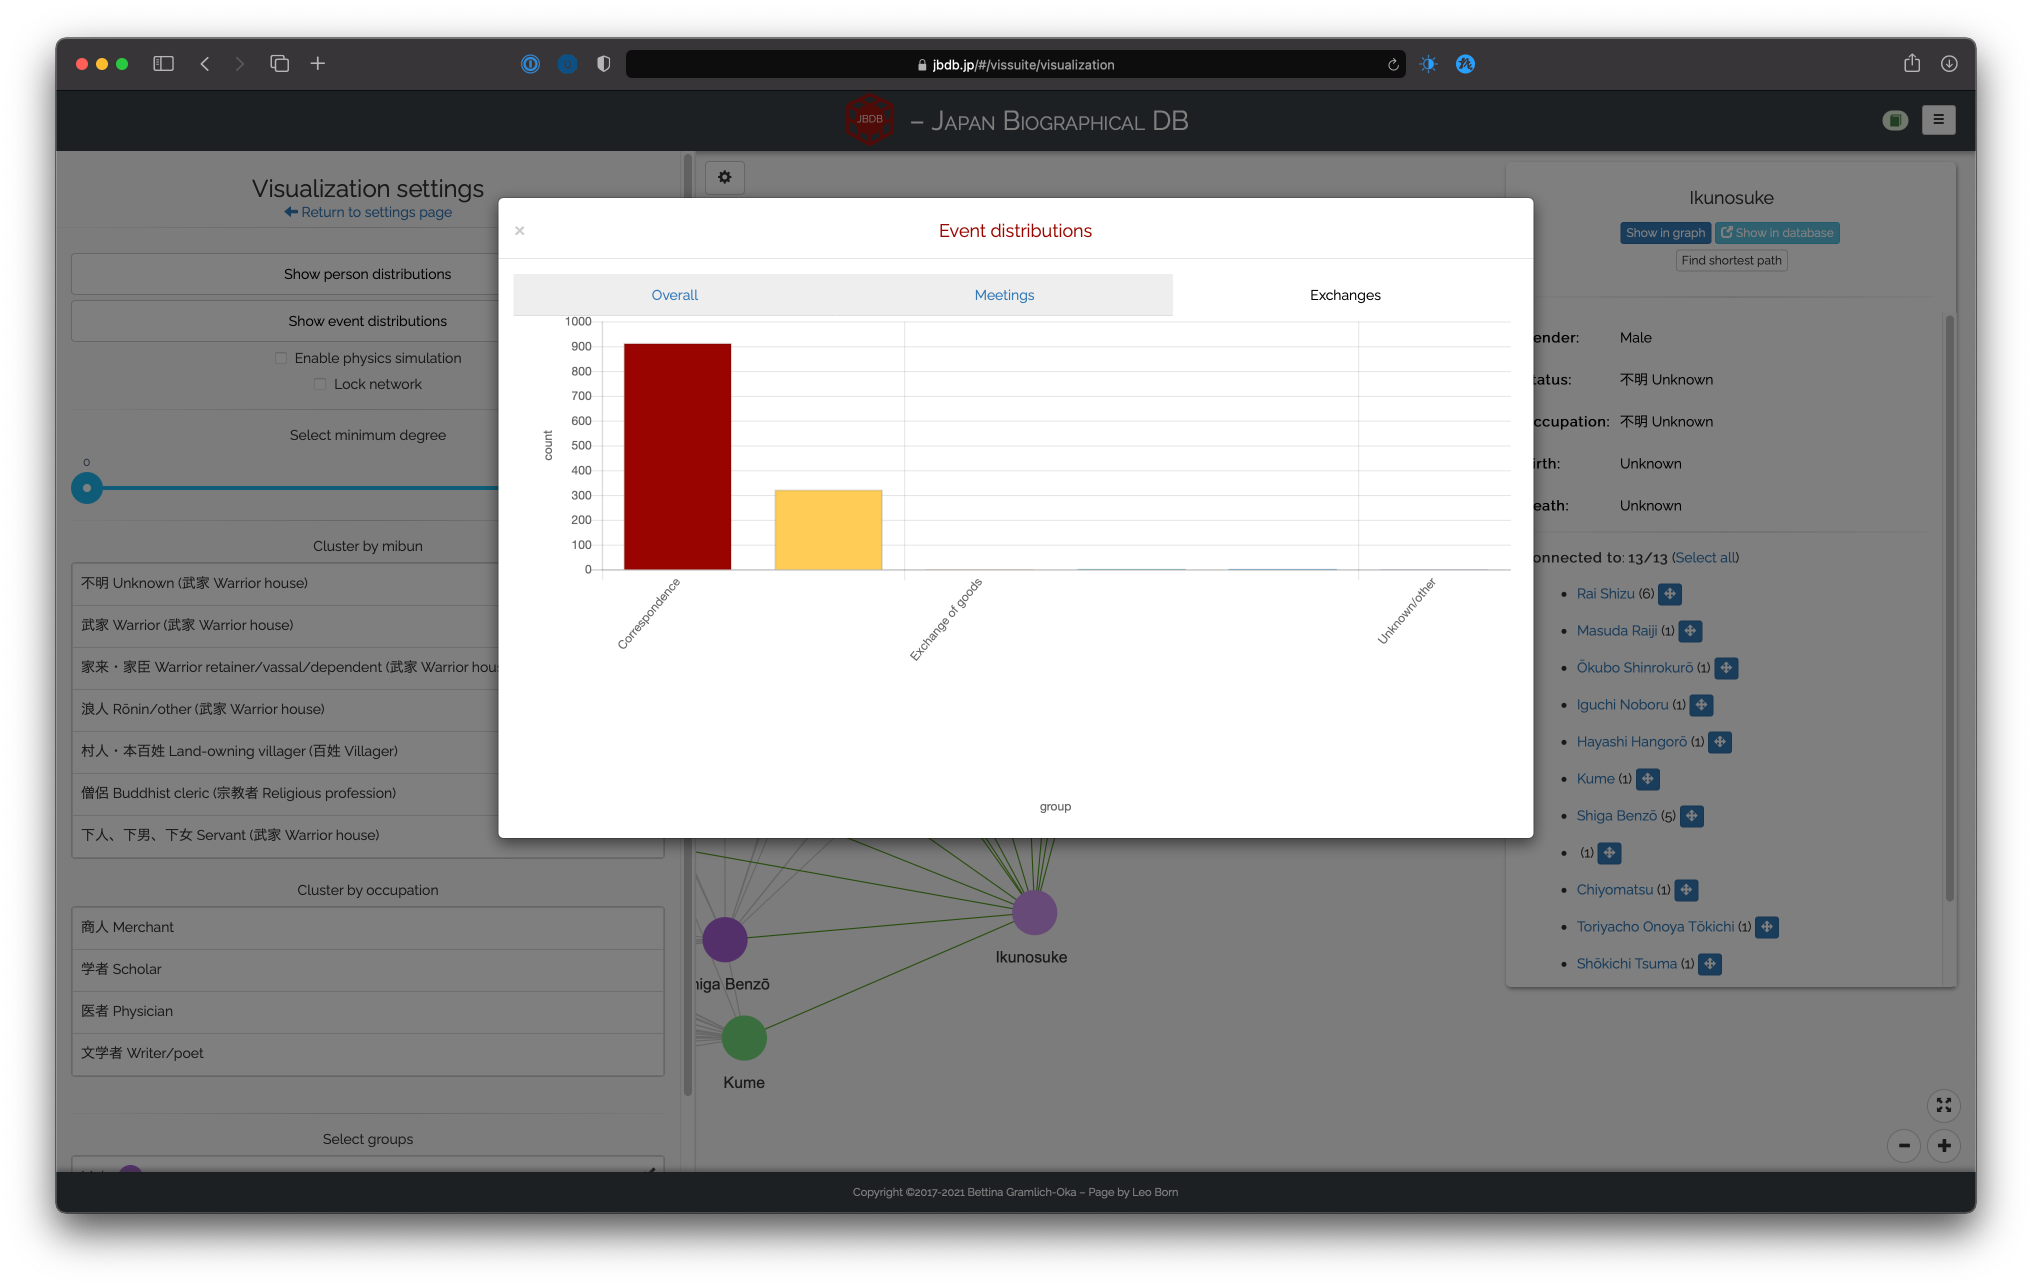
Event distributions
The second distribution modal concerns the underlying events and shows information on the 1) overall distribution of events (meetings vs. exchanges):
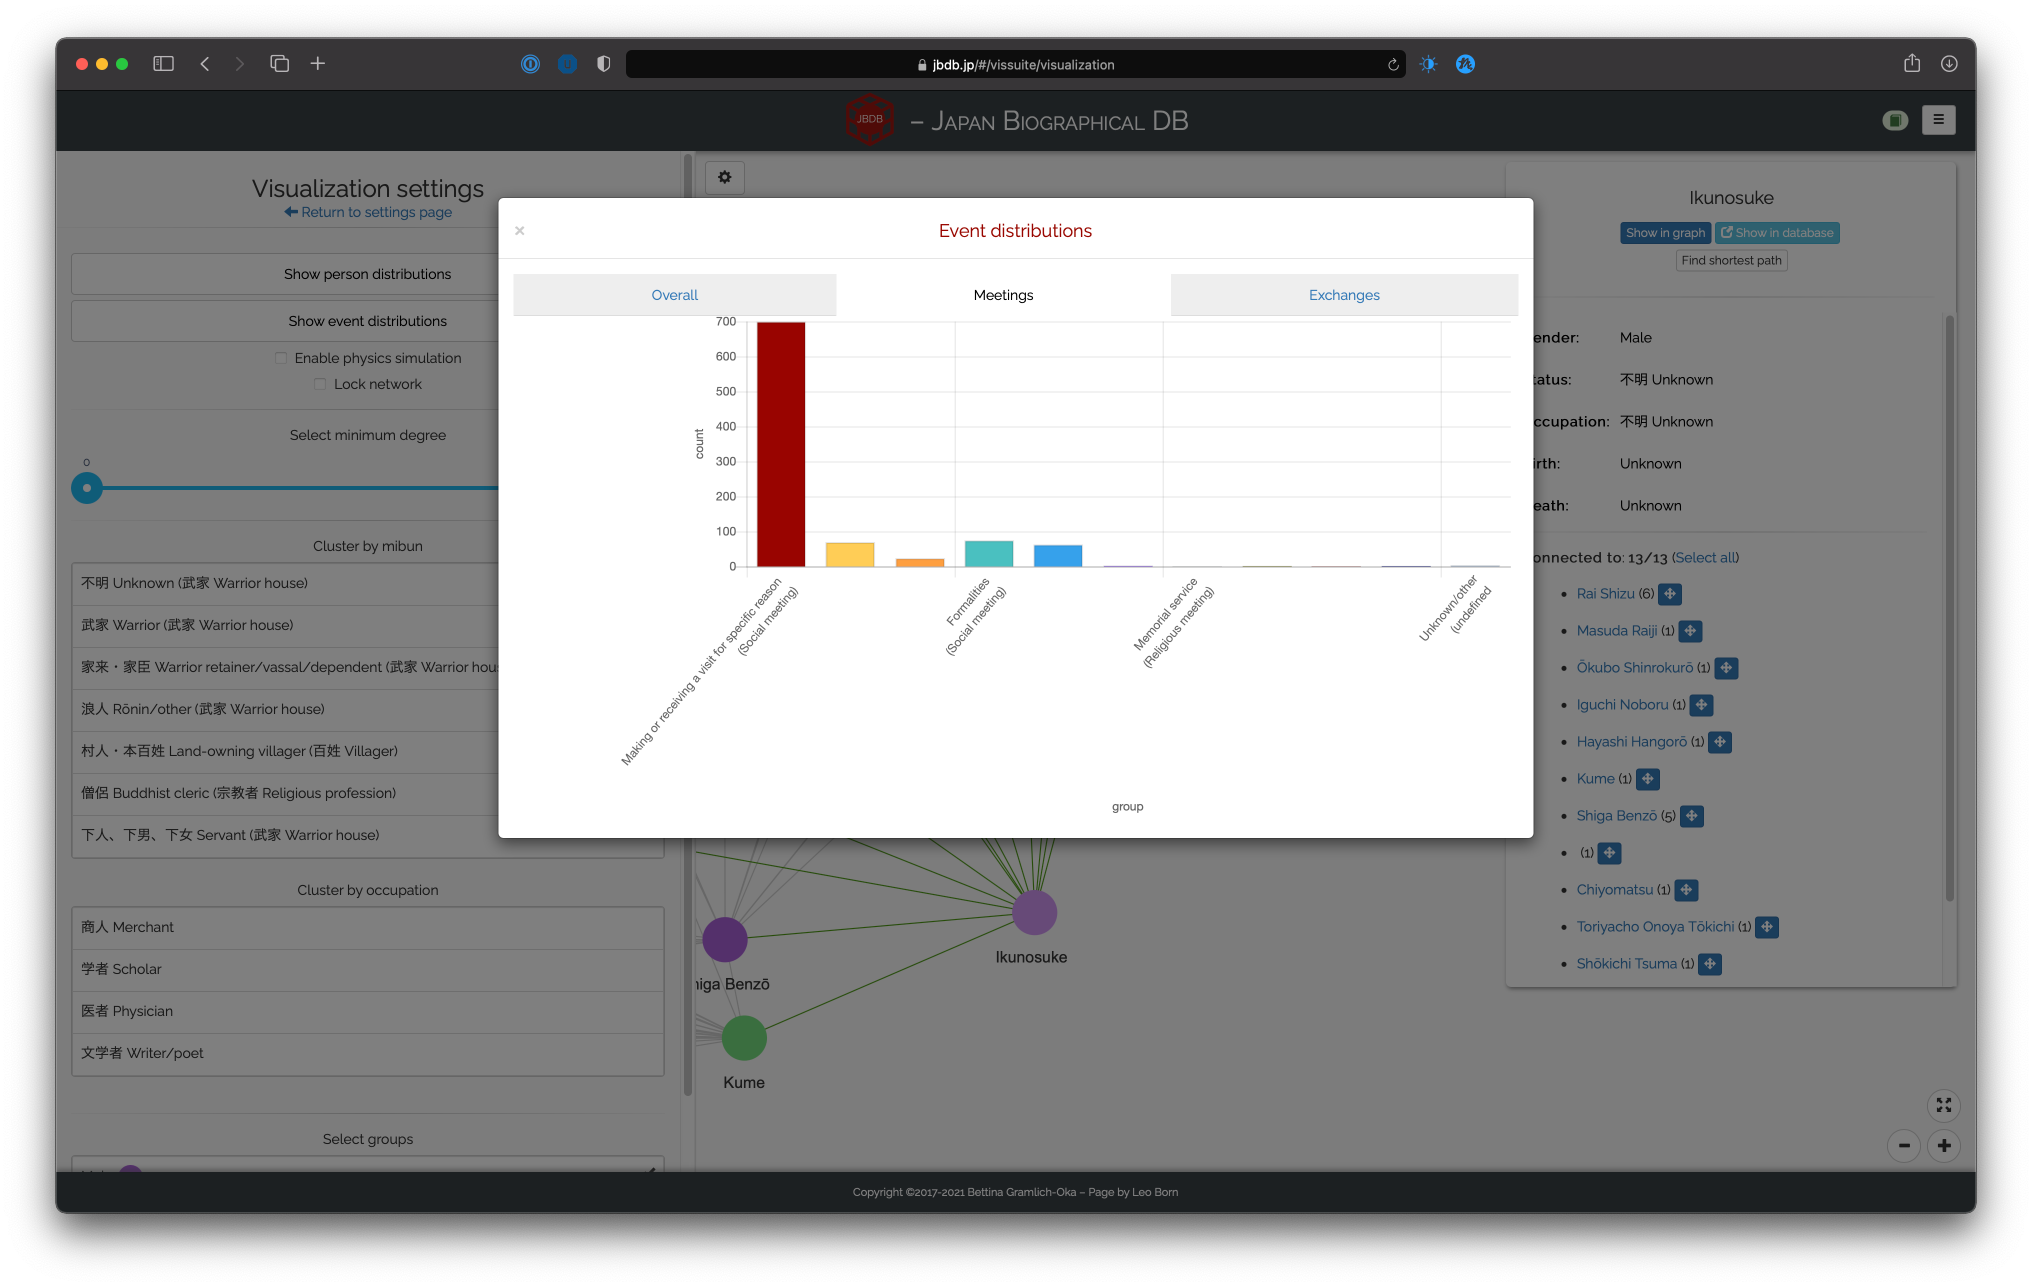
2) a detailed breakdown for meetings:
and 3) a detailed breakdown for exchanges:
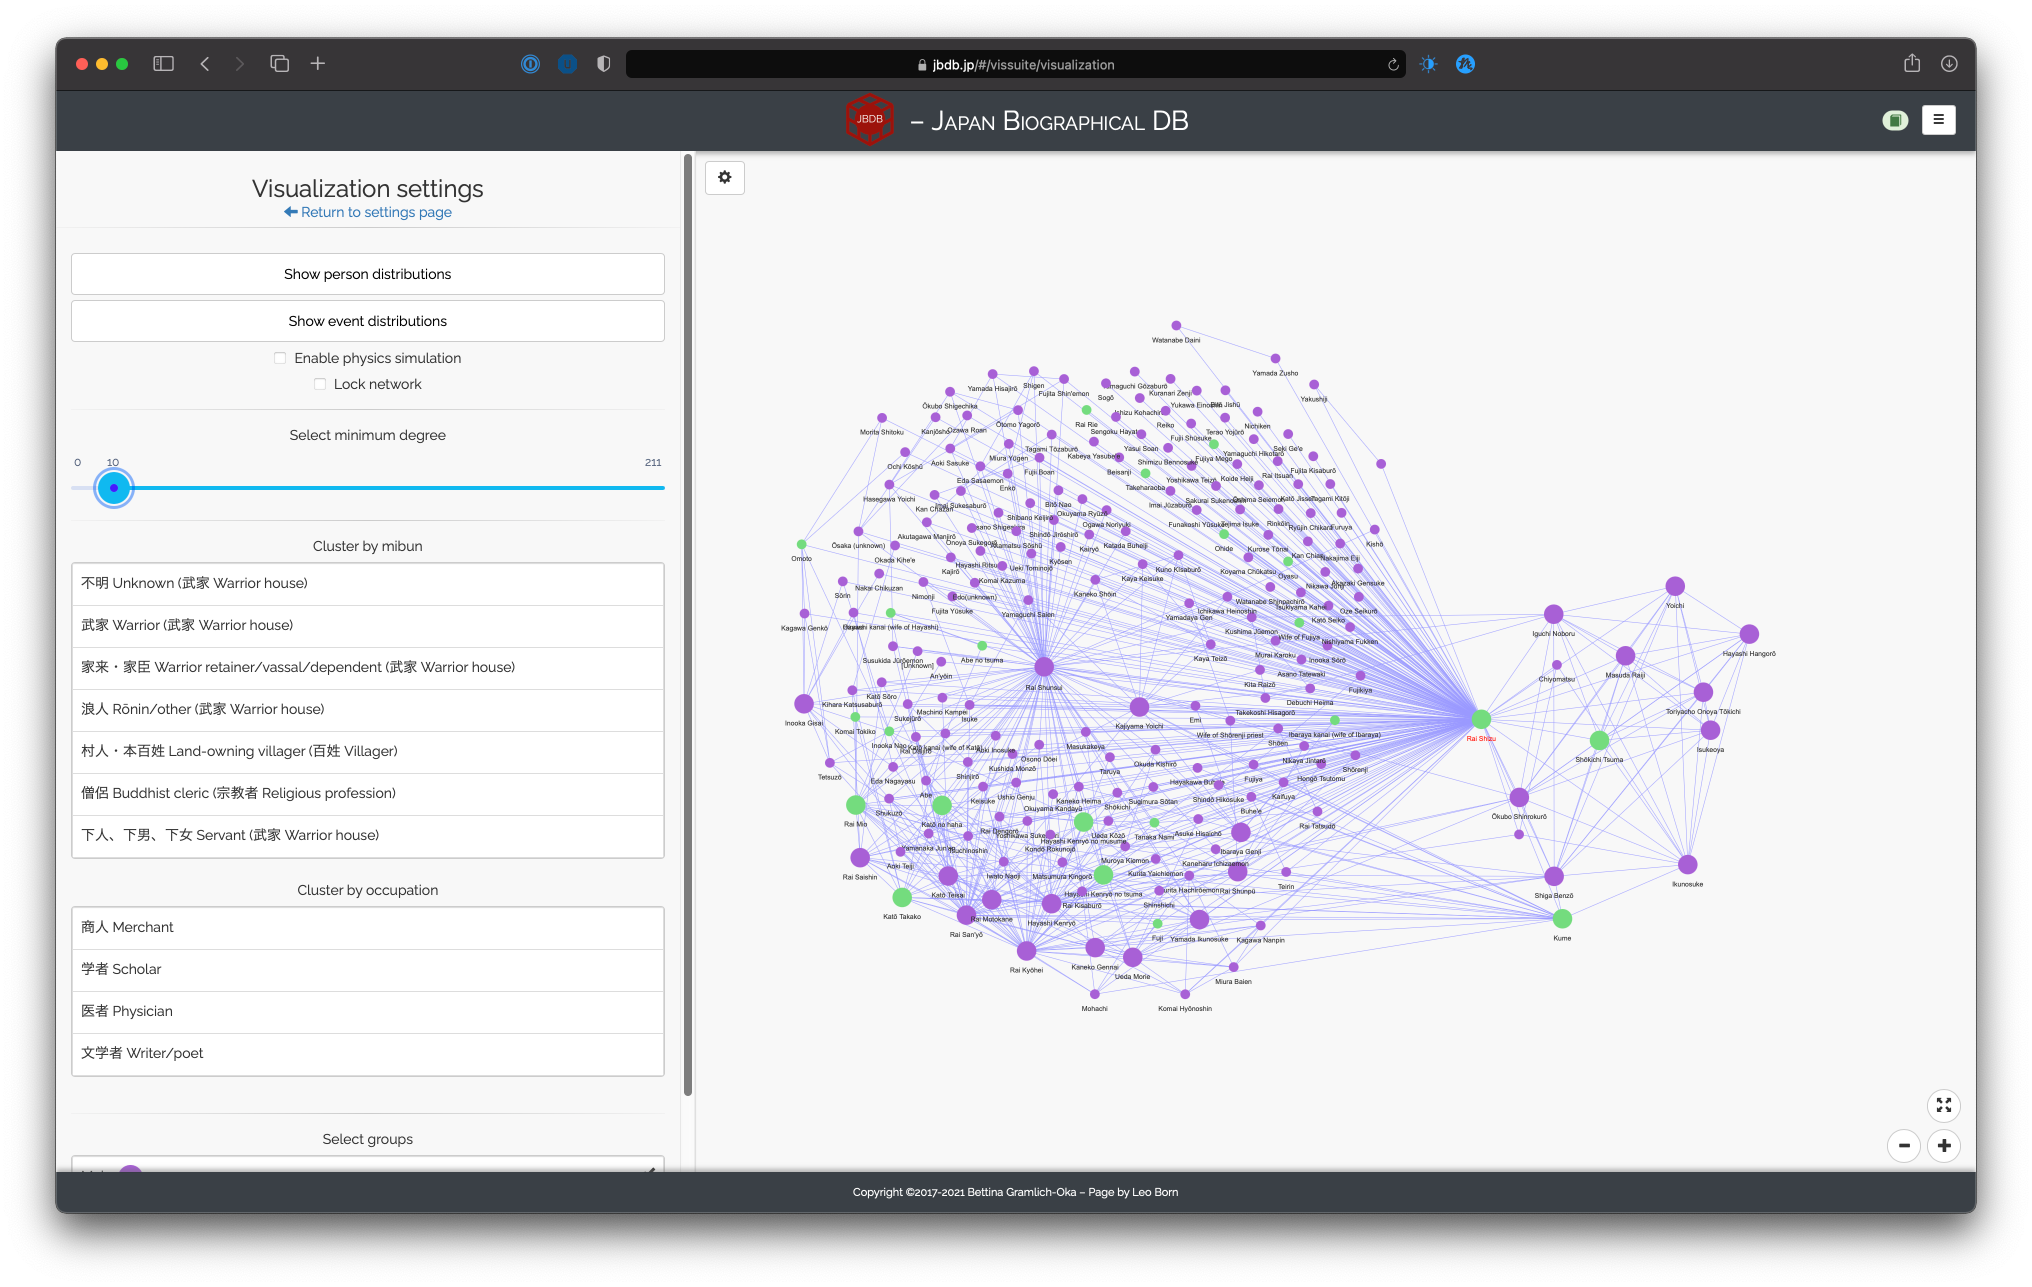
The next part of the settings menu contains a slider and allows you to select the minimum degree of a person to show larger than persons with a lower degree. Since we did not set the setting to show the importance of persons, this is the basic way of separating more important from less important persons based on degree centrality at a glance. Thus, if we set the threshold to ten, for example, only people with ten or more connections are shown large:
The middle part of the menu contains lists of mibun (statuses) and occupations by which you can cluster persons. This is useful if you are interested in more macro-level analyses of connections, e.g. to how many land-owning villagers were there and to whom were they conncted:
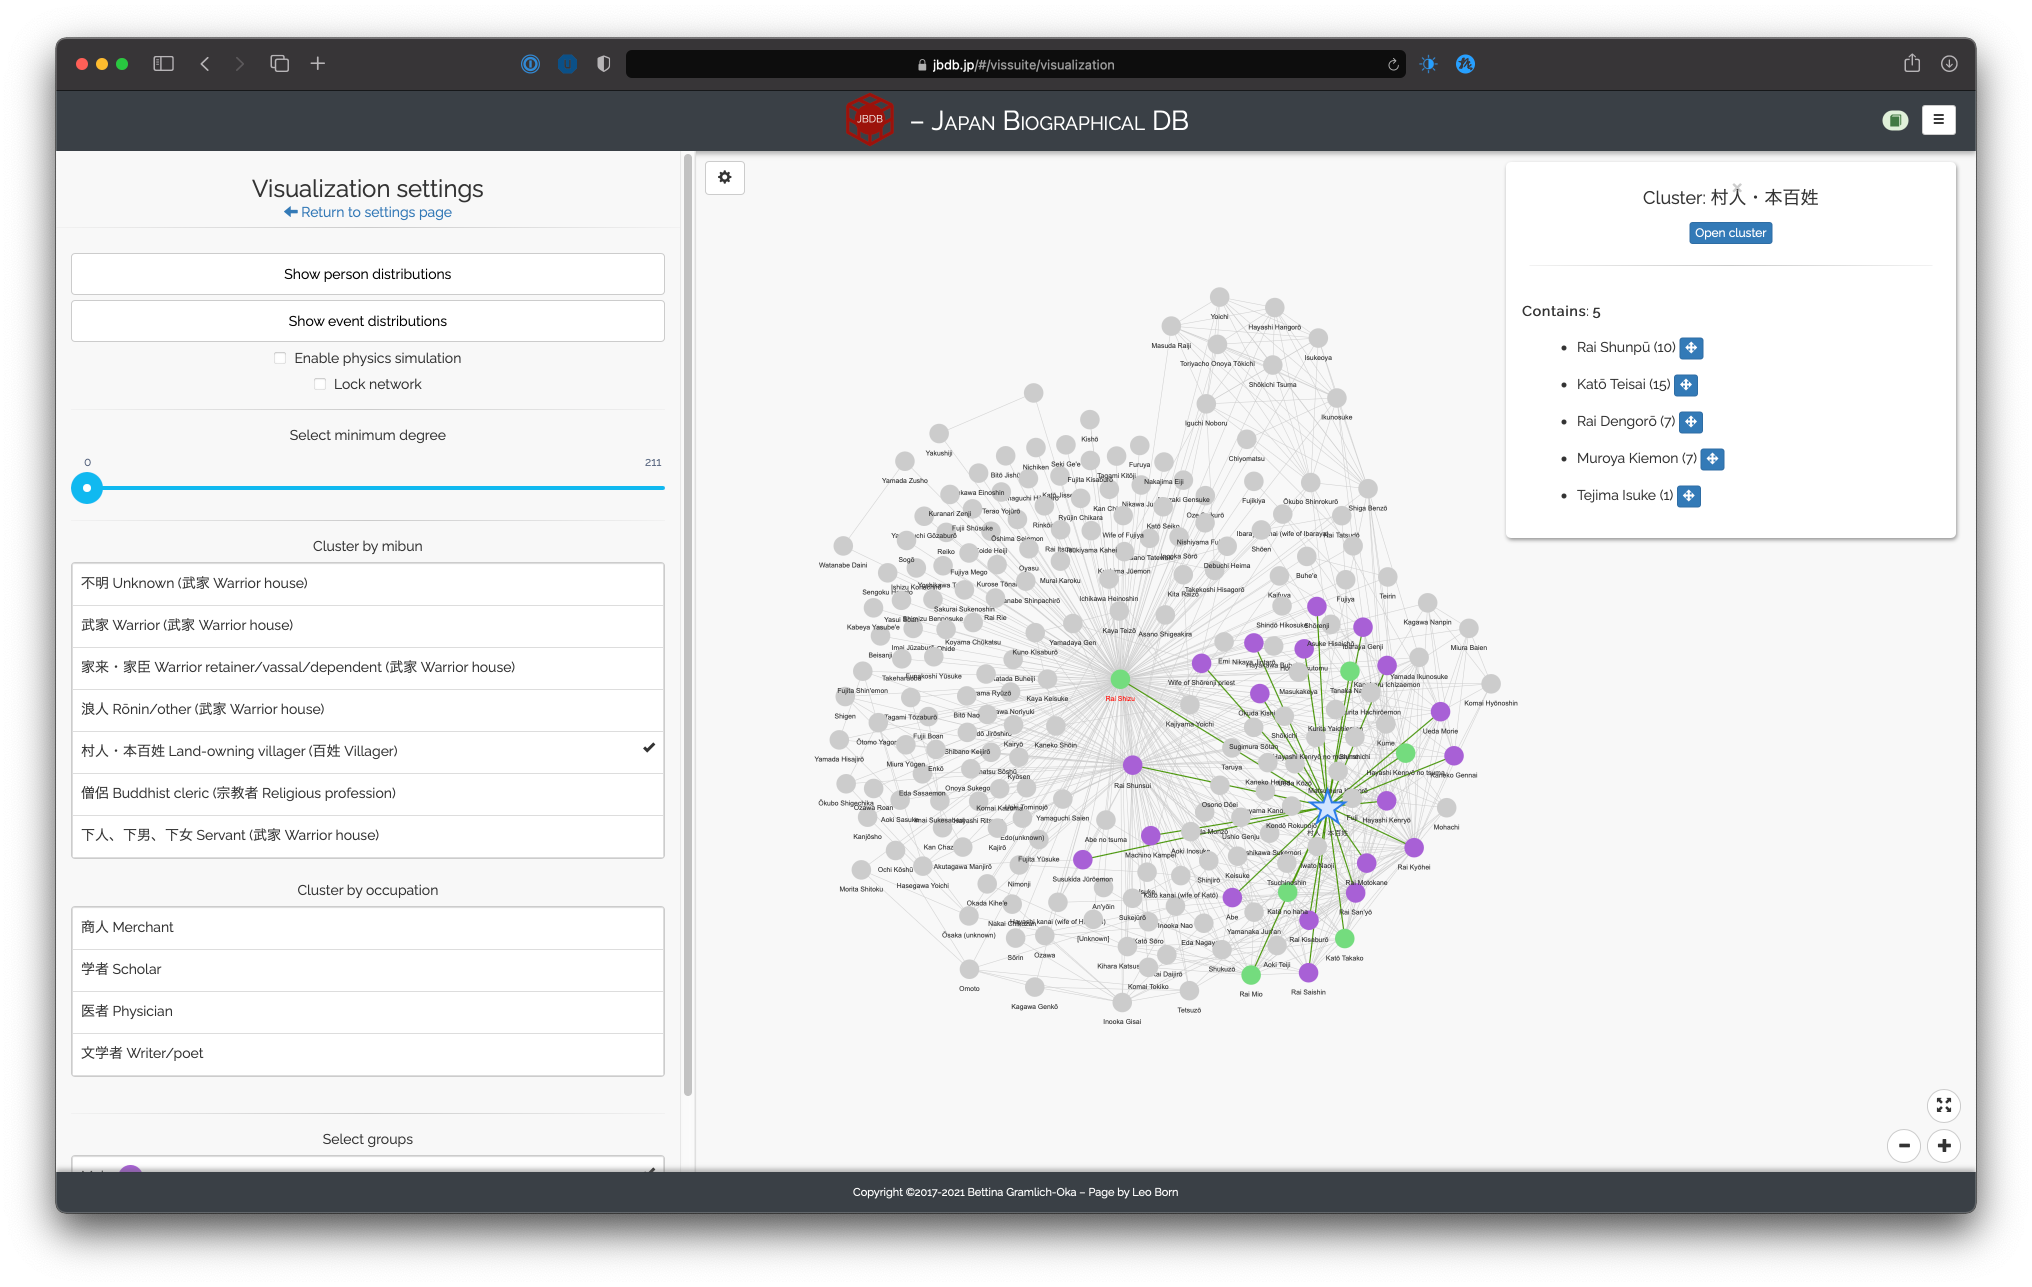
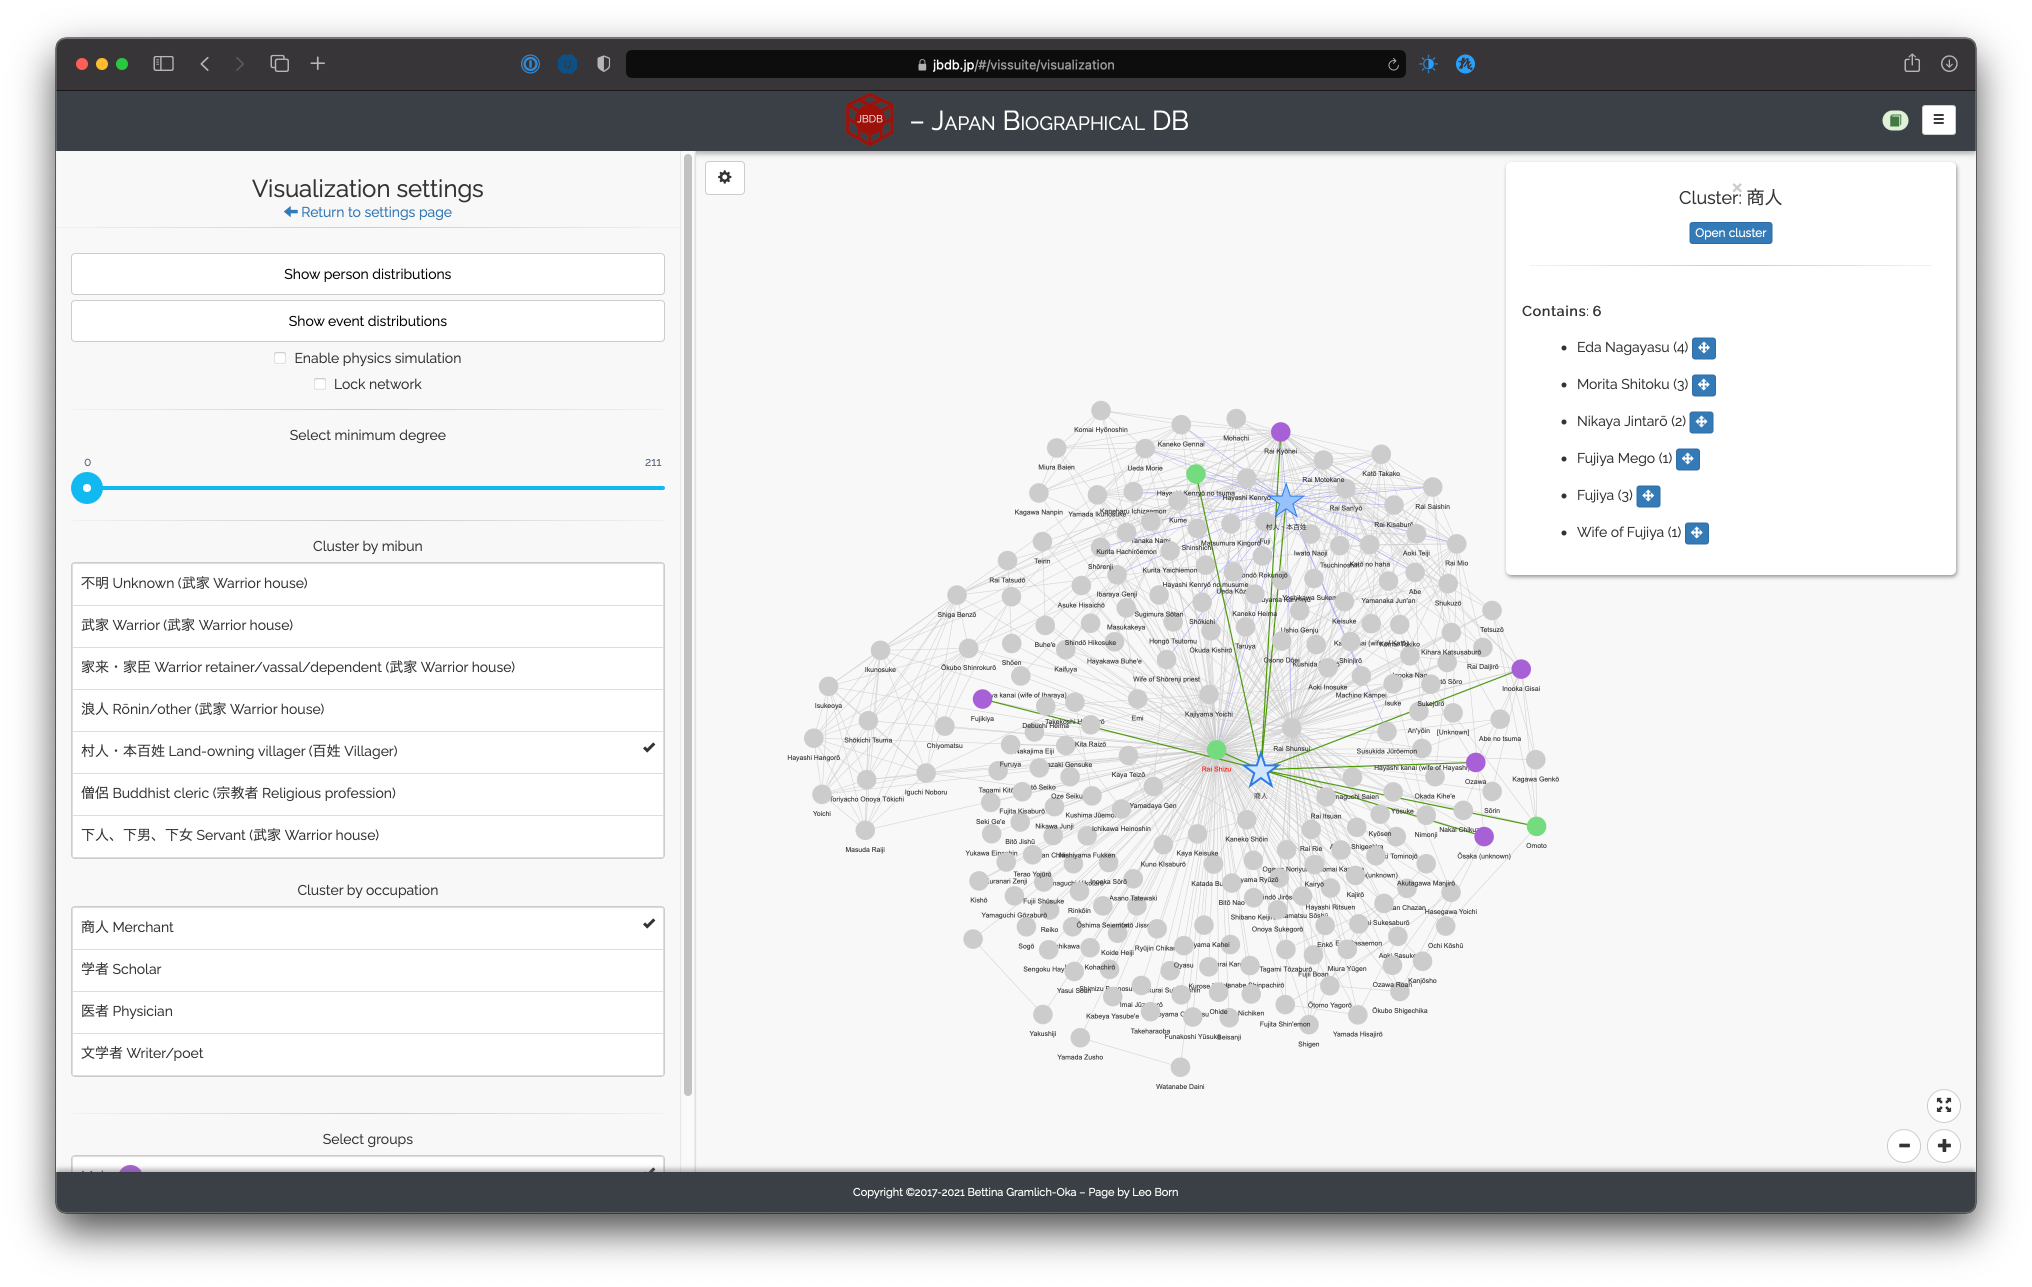
Clusters are shown as star-shaped nodes and you can cluster by multiple attributes (either multiple statues, occupations, or a mix):
A cluster can be disassembled by either clicking on the attribute in the list again (active attributes are indicated by a check mark) or by clicking “Open cluster” in the overlay window of the resulting cluster. This will automatically trigger “Enable physics simulation” (see above) to animate the cluster opening so that the contained nodes can smoothly be re-integrated into the overall layout of the network:2
Note that due to the complexities introduced by the time slider, clustering is not available when the time slider is enabled.
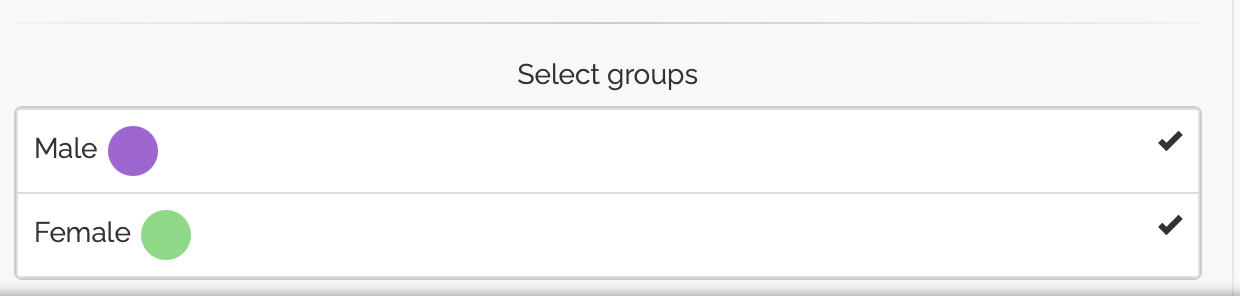
The last part of the settings menu allows you to hide or show nodes based on the attributes by which we selected group highlighting at the beginning (gender, per default). This, using the “Select groups” list, you could only retain all women in the network by hiding men (shown groups are indicated by the check mark):
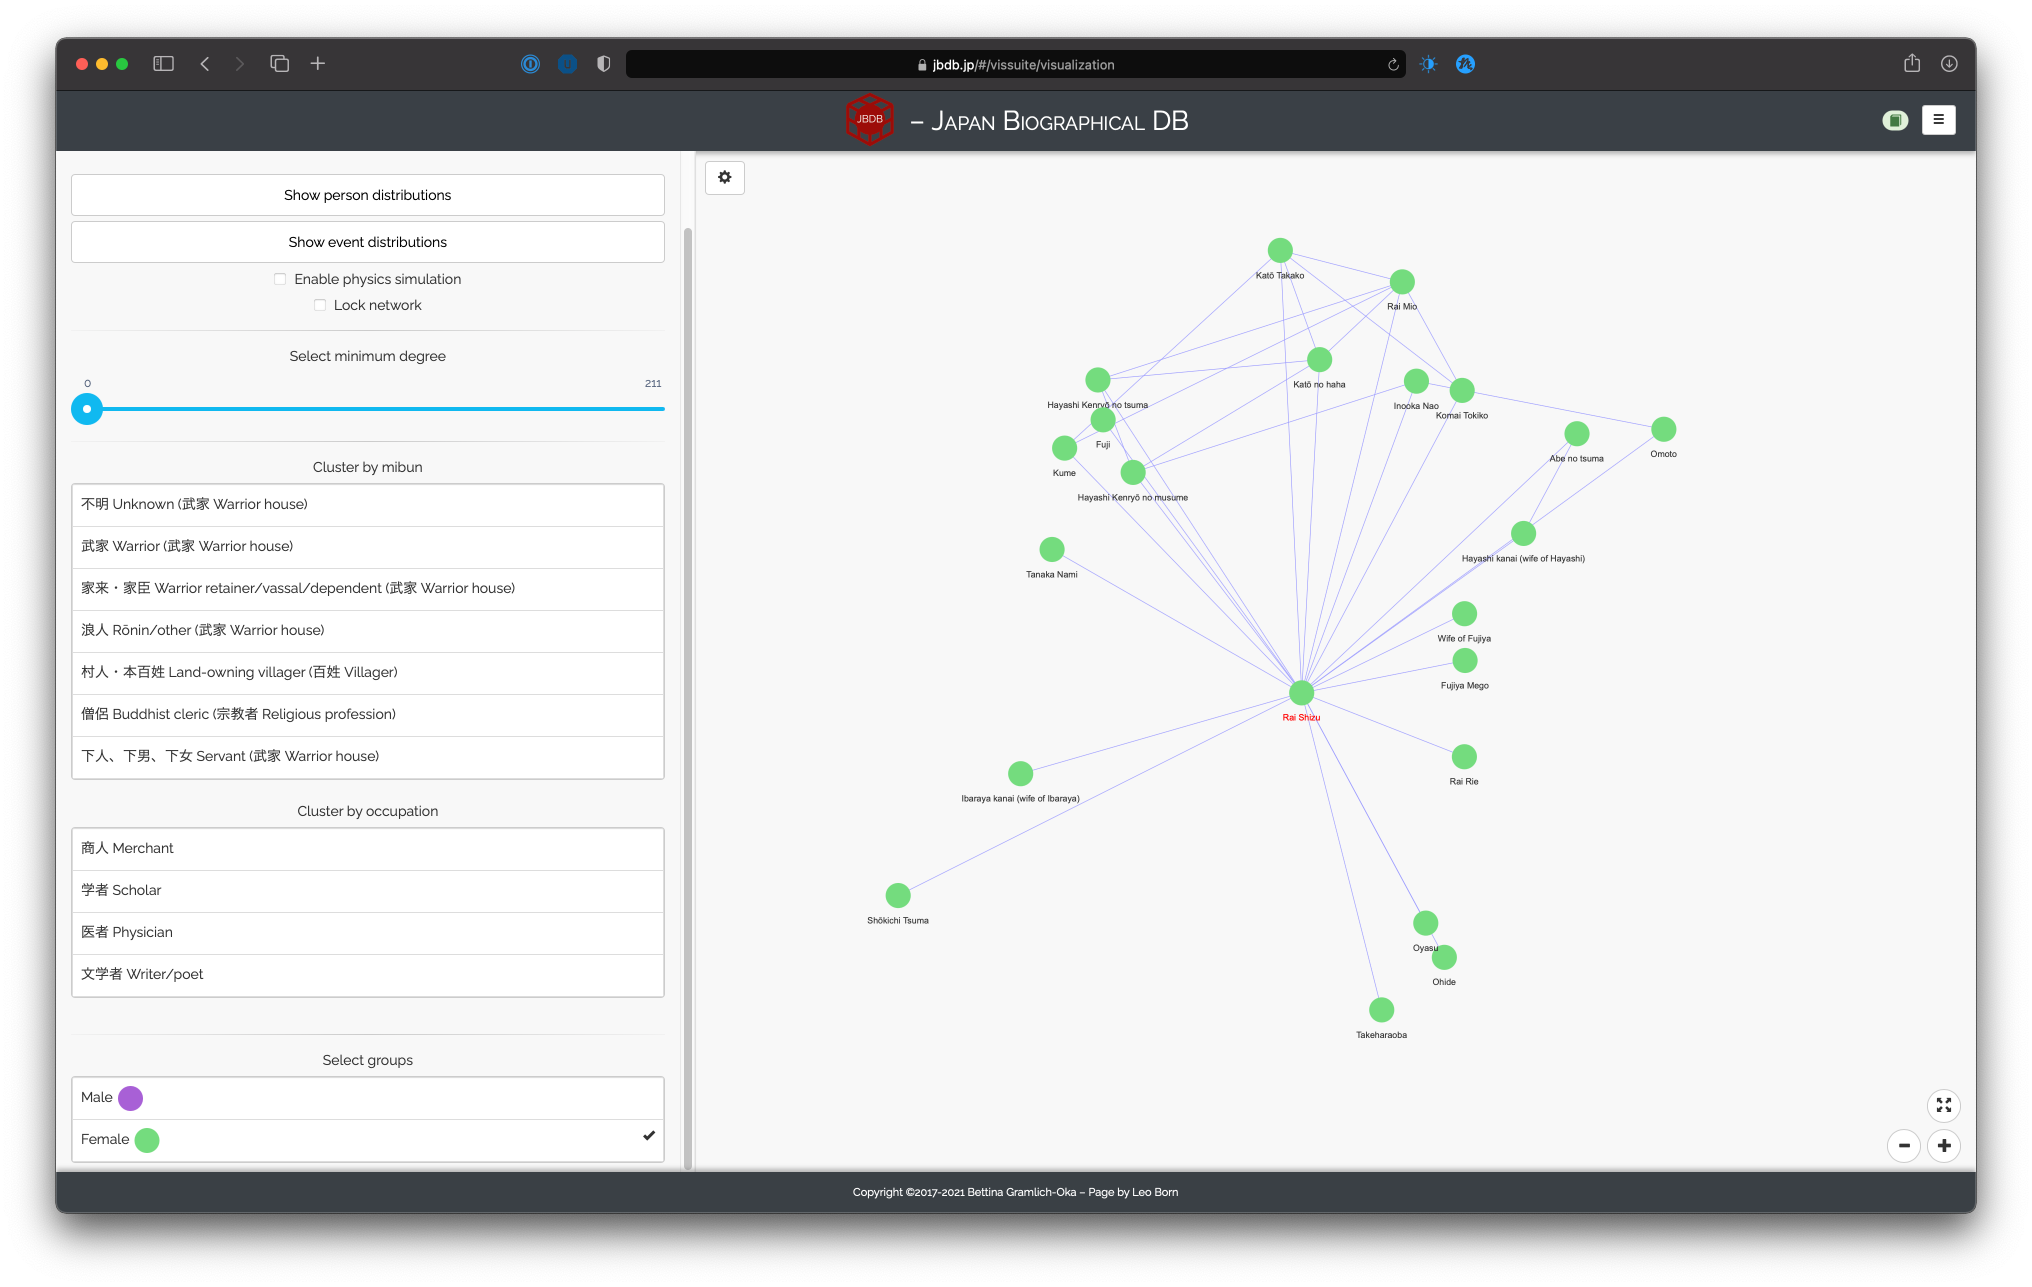
For easier identifiability, groups are randomly associated with distinct colors, which are shown next to the group name in the list. To make men re-appear in the network, click on “Male” in the list again.
Note that any of the operations discussed above (clustering, group selection) appropriately updates the network statistics in the bottom-left corner of the canvas (shown above). That is, hiding men, for example now shows this:
Search menu
Time slider
Centrality metrics
(Non-)kinship network
1. Since some elements on the canvas are dependent on the underlying network settings, we will also show different network settings and their effects on the interaction.↩
2. This may result in the network spinning around for a while, which causes the network to look different than before (see screenshots).↩