Contents
Intro
Who to visualize?
The first settings section allows you to select the persons to base the visualizations on in five different ways:

Apart from the the “All” setting, which visualizes all persons in the JBDB, the other options work as follows: you select persons either directly (“Select by name”) or by source(s)/attribute; these seed persons are then used to find all other persons with whom they are connected, and this final set of persons will be visualized.
Going through each option individually, this should become clear.
Choosing “Select by name” displays a search bar and two boxes. By searching for persons, the left box will be filled with the matching results.1 You can now either select individual persons by clicking on them or move all found persons to the right box by clicking the right arrow symbol. You can de-select persons by either clicking on them in the right box or by clicking the left arrow symbol. They are then available in the left box again.
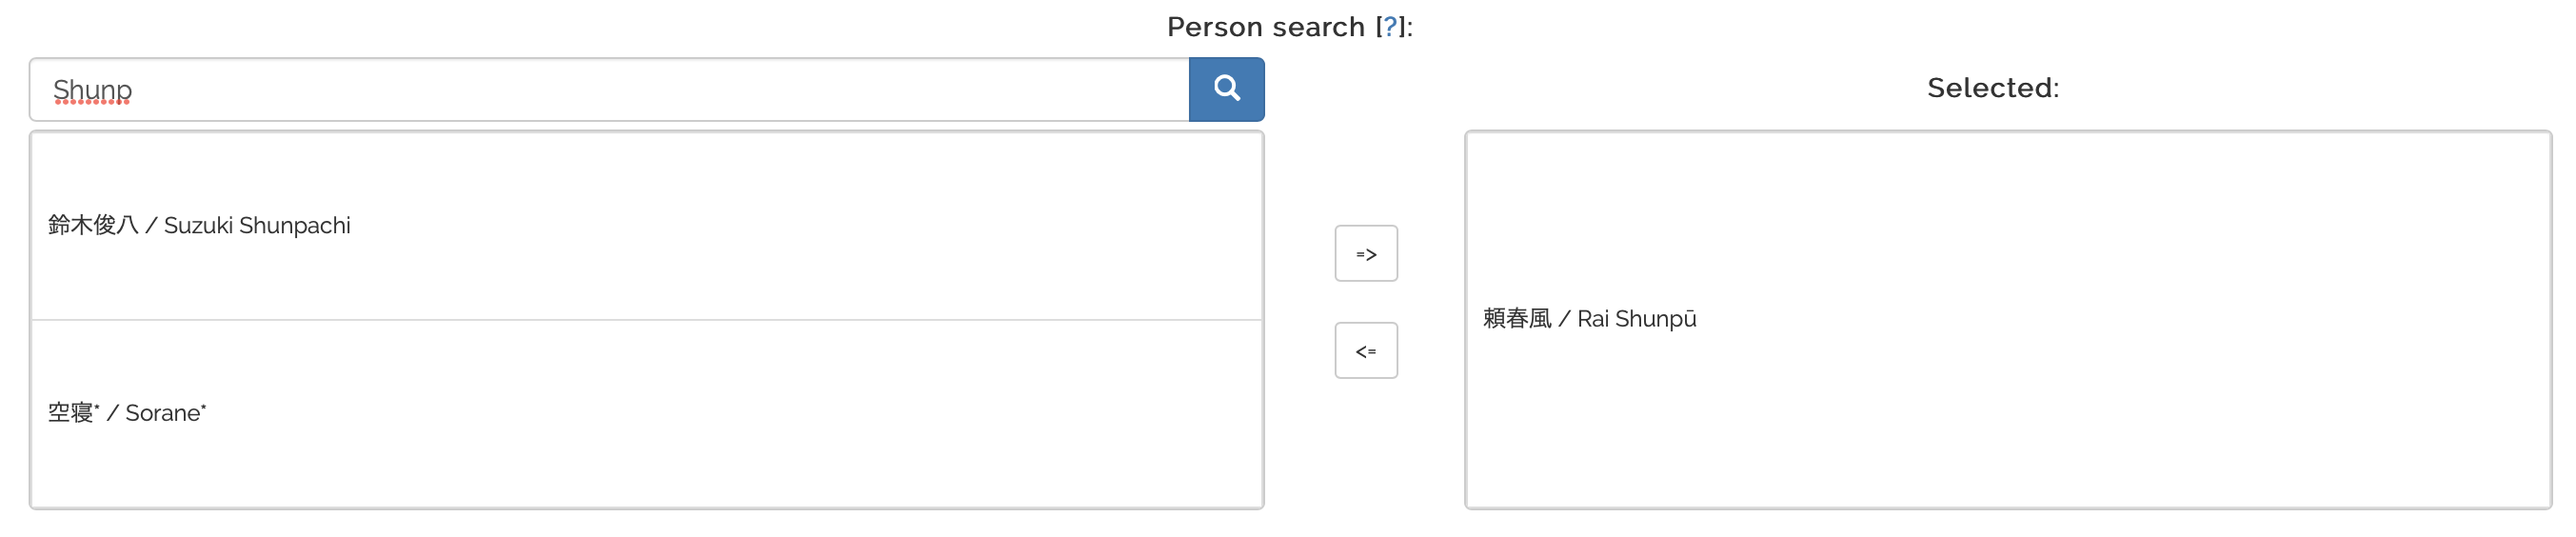
In our example, we would look for all connections Rai Shunpū has in the DB and get all the associated persons. The final visualization would include Rai Shunpū and all connected persons.
Choosing “Select by source”, “Select by status (mibun)”, or “Select by occupation” displays a dropdown from which you can select as many categories as you wish. The status dropdown shall serve as an illustrative example:
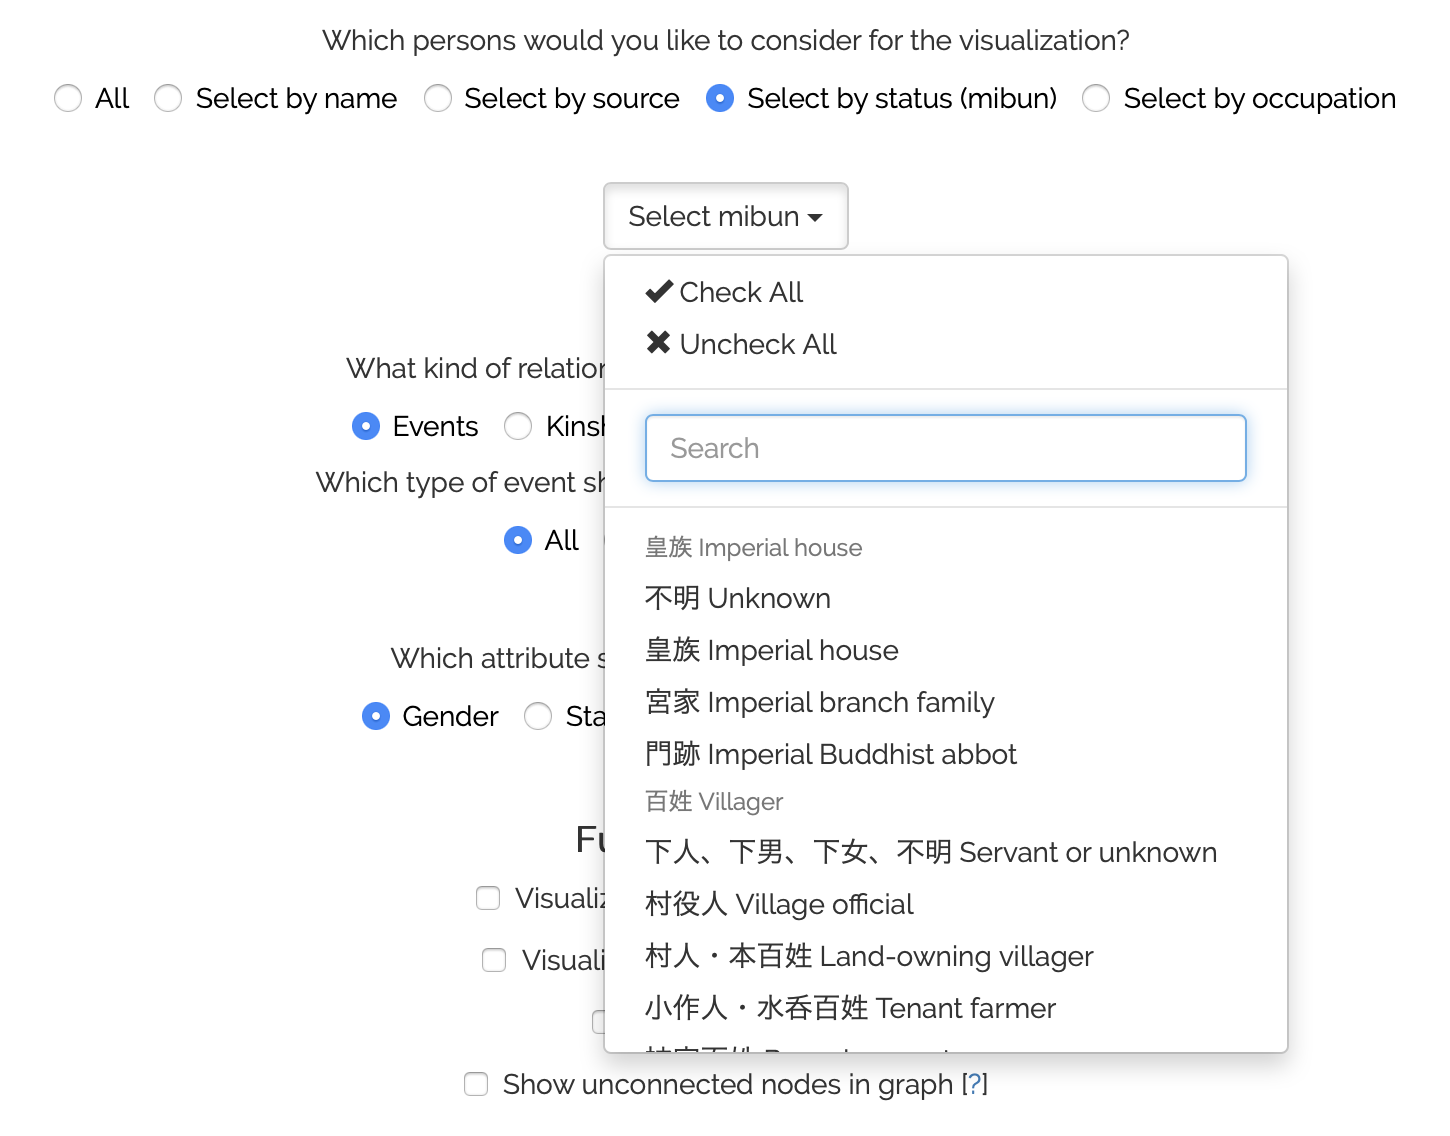
As you can see, you can quickly select or de-select all available categories at once, search for them, or simply manually select the categories of interest.
Using this dropdown results in a seed person set of all persons in the DB matching the chosen method. That is, if you select source(s), all persons for whom the selected source(s) were used are gathered; if you select status(es), all persons with the matching status(es) are gathered; and lastly, if you select occupation(s), all persons with the matching occupations(s) are gathered.
As above, starting from these gathered persons, all connected persons are extracted from the DB and thus the final visualization would include the gathered persons and their connected persons.2
What to visualize?
The next settings section is concerned with the underlying data that connections should be based on.
NOTE that currently, only event locations are shown on a map. Biographical information follows soon.
1. This search also accounts for alternative names. As in the persons view, they will be marked with an asterisk (*).↩